Method Execution Tree
Terminology
Throughout the entire documentation, we use some terminology regarding the execution of methods. The picture below presents a single method execution tree. The first element of the tree is called Entry Point. All the methods' calls, down the execution chain, are called Invocations. The entire structure is called Execution Tree.

An entire execution tree is completed and built on the server. When some invocation comes to the server, and the corresponding execution tree, it is part of, cannot be found, a new tree is created. The entry point of this tree is then called Incomplete Entry Point. When the entry point is completed, then its execution tree is stored in the database.
Execution Tree Structure
The picture below depicts the procedure of how the execution tree is built. In the picture below you can see four, sample execution trees of some method A call.
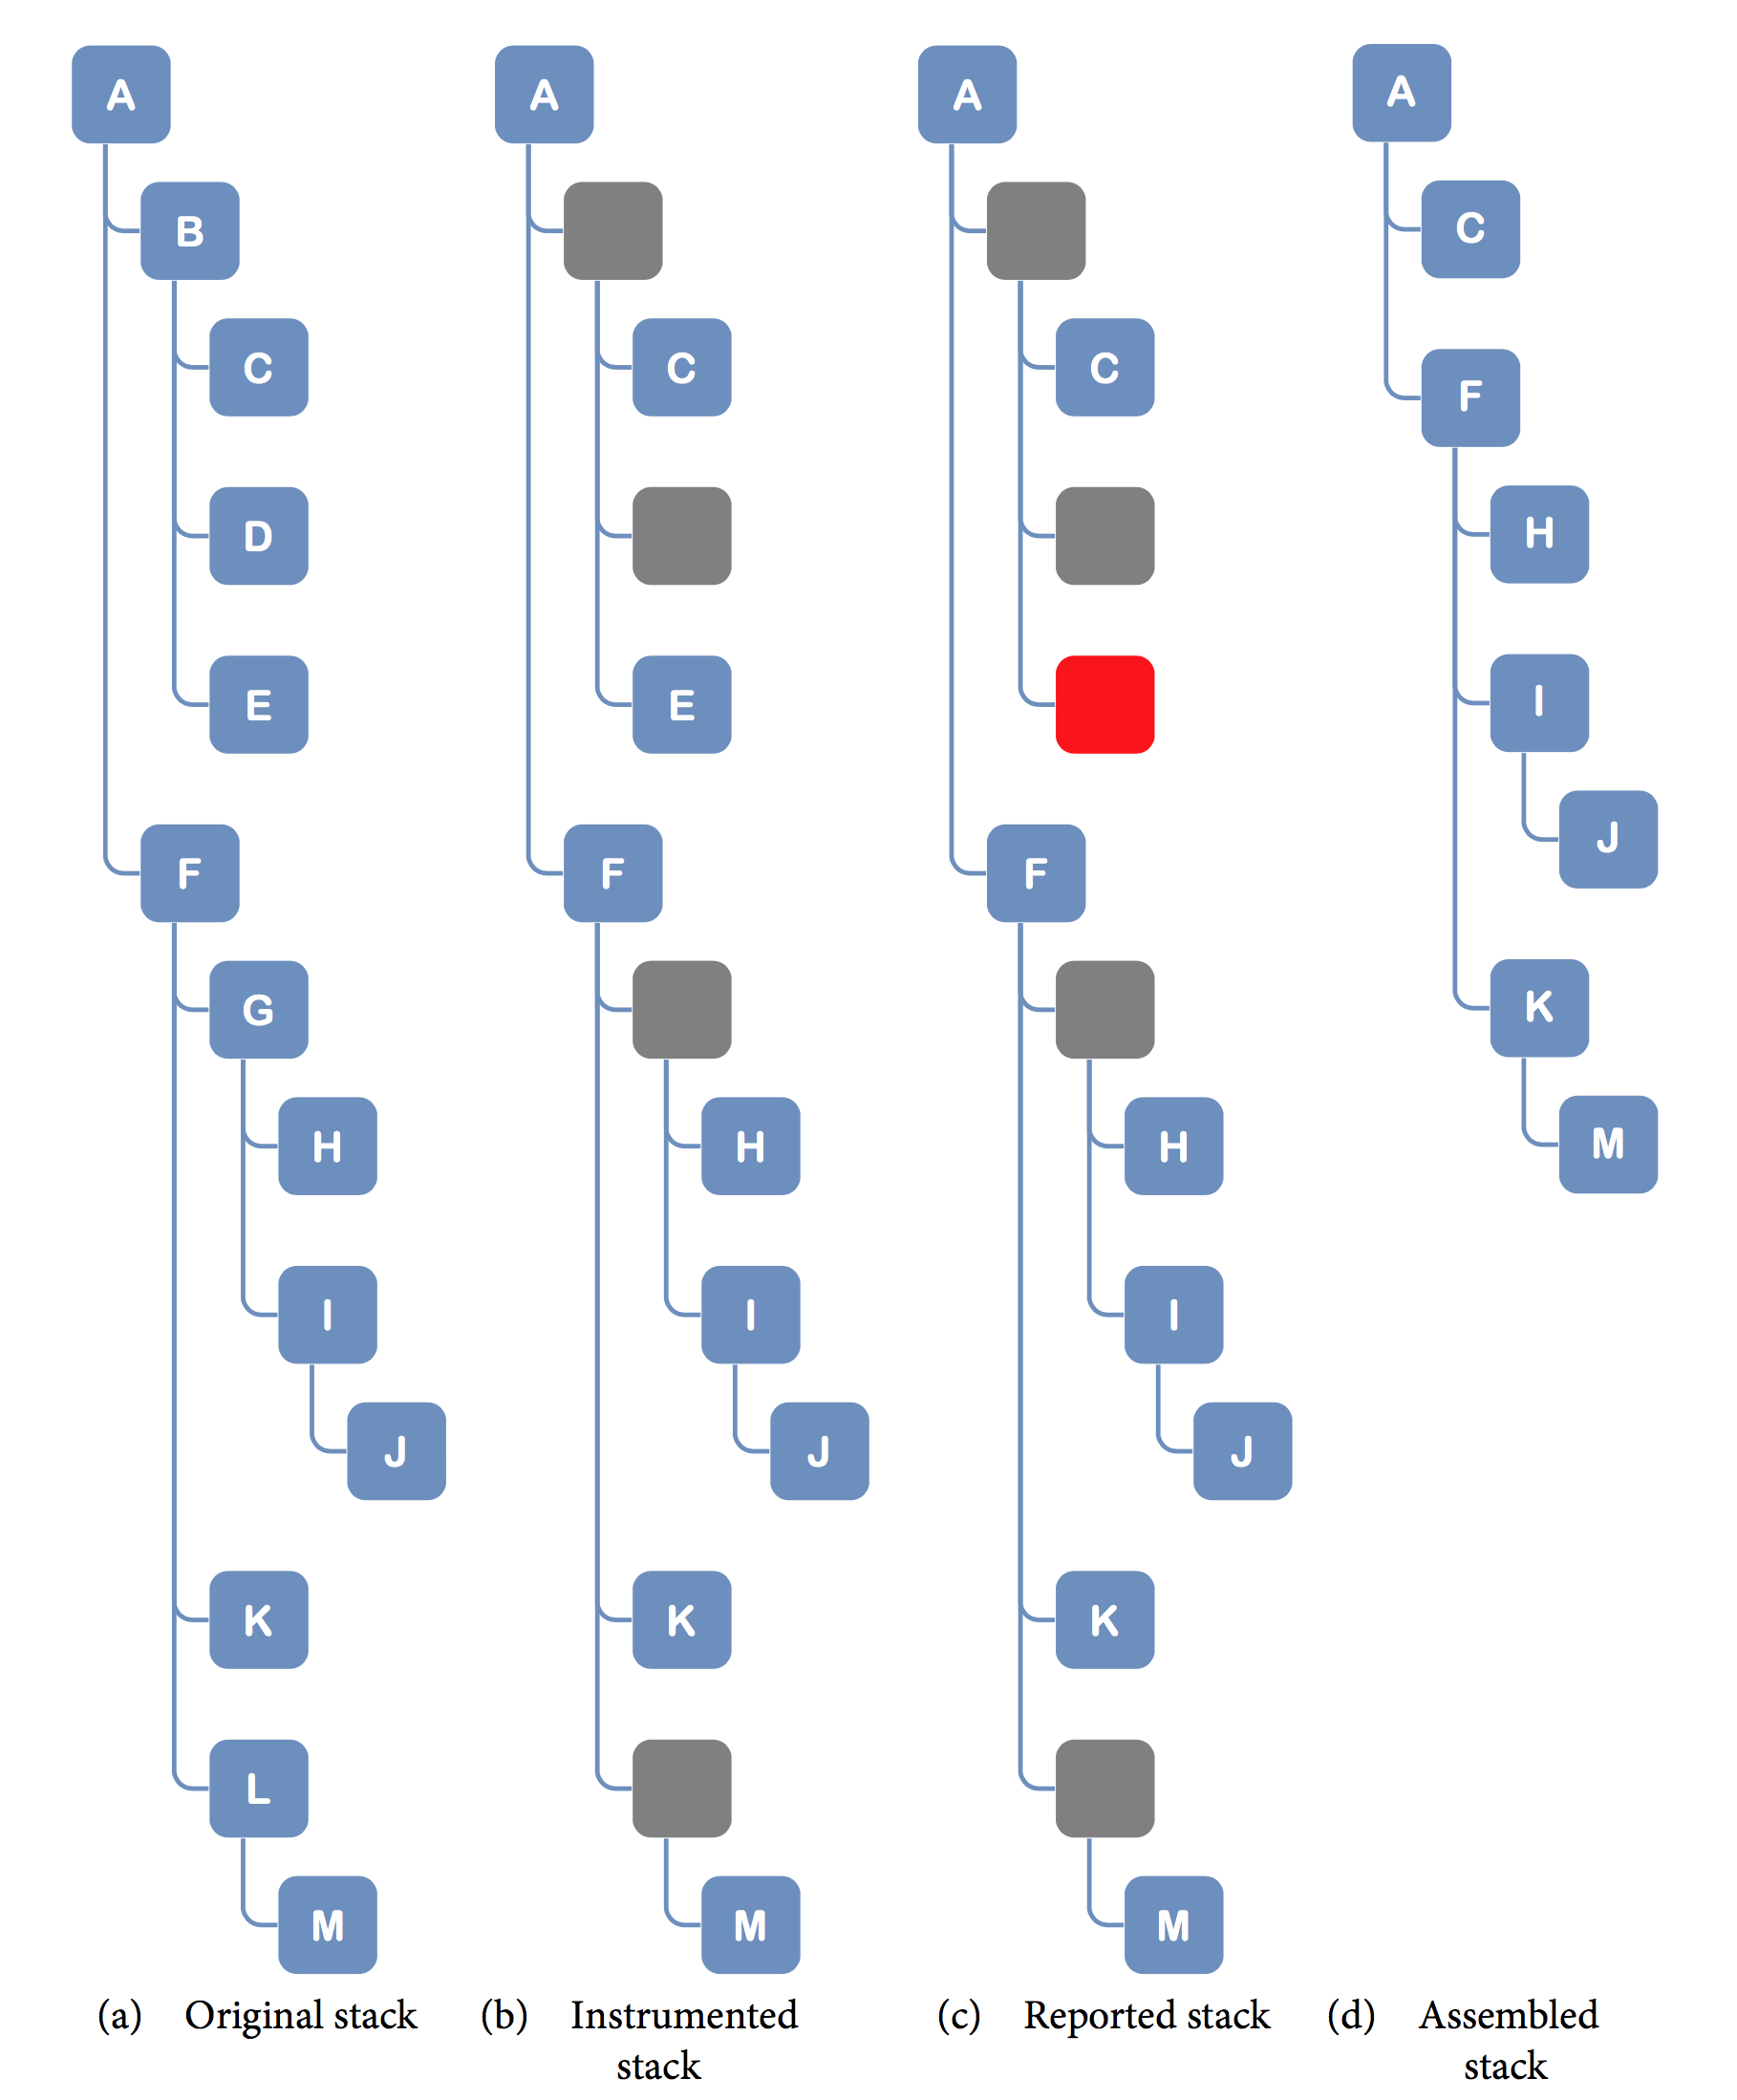
The first a view shows how the real execution stack looks. This is a real execution flow that takes place in your application. The second b view presents the same stack instrumented by your agent. Depending on your configuration, the instrumentation may not cover the entire stack. The empty, grey boxes represent missed, not instrumented methods. As you can see, at this very point your instrumented execution flow is not complete. Moreover, in your application runtime, there can be situations when some of the instrumented method calls will not be reported. The empty, red boxes in the third c view represent this situation. Finally, what you actually observe in the workstation is the last d view. This view presents an assembled stack with missing calls ignored. Now you know how to interpret the execution stack in the workstation and why the resulting stack can differ from the original one.