Data Inspector
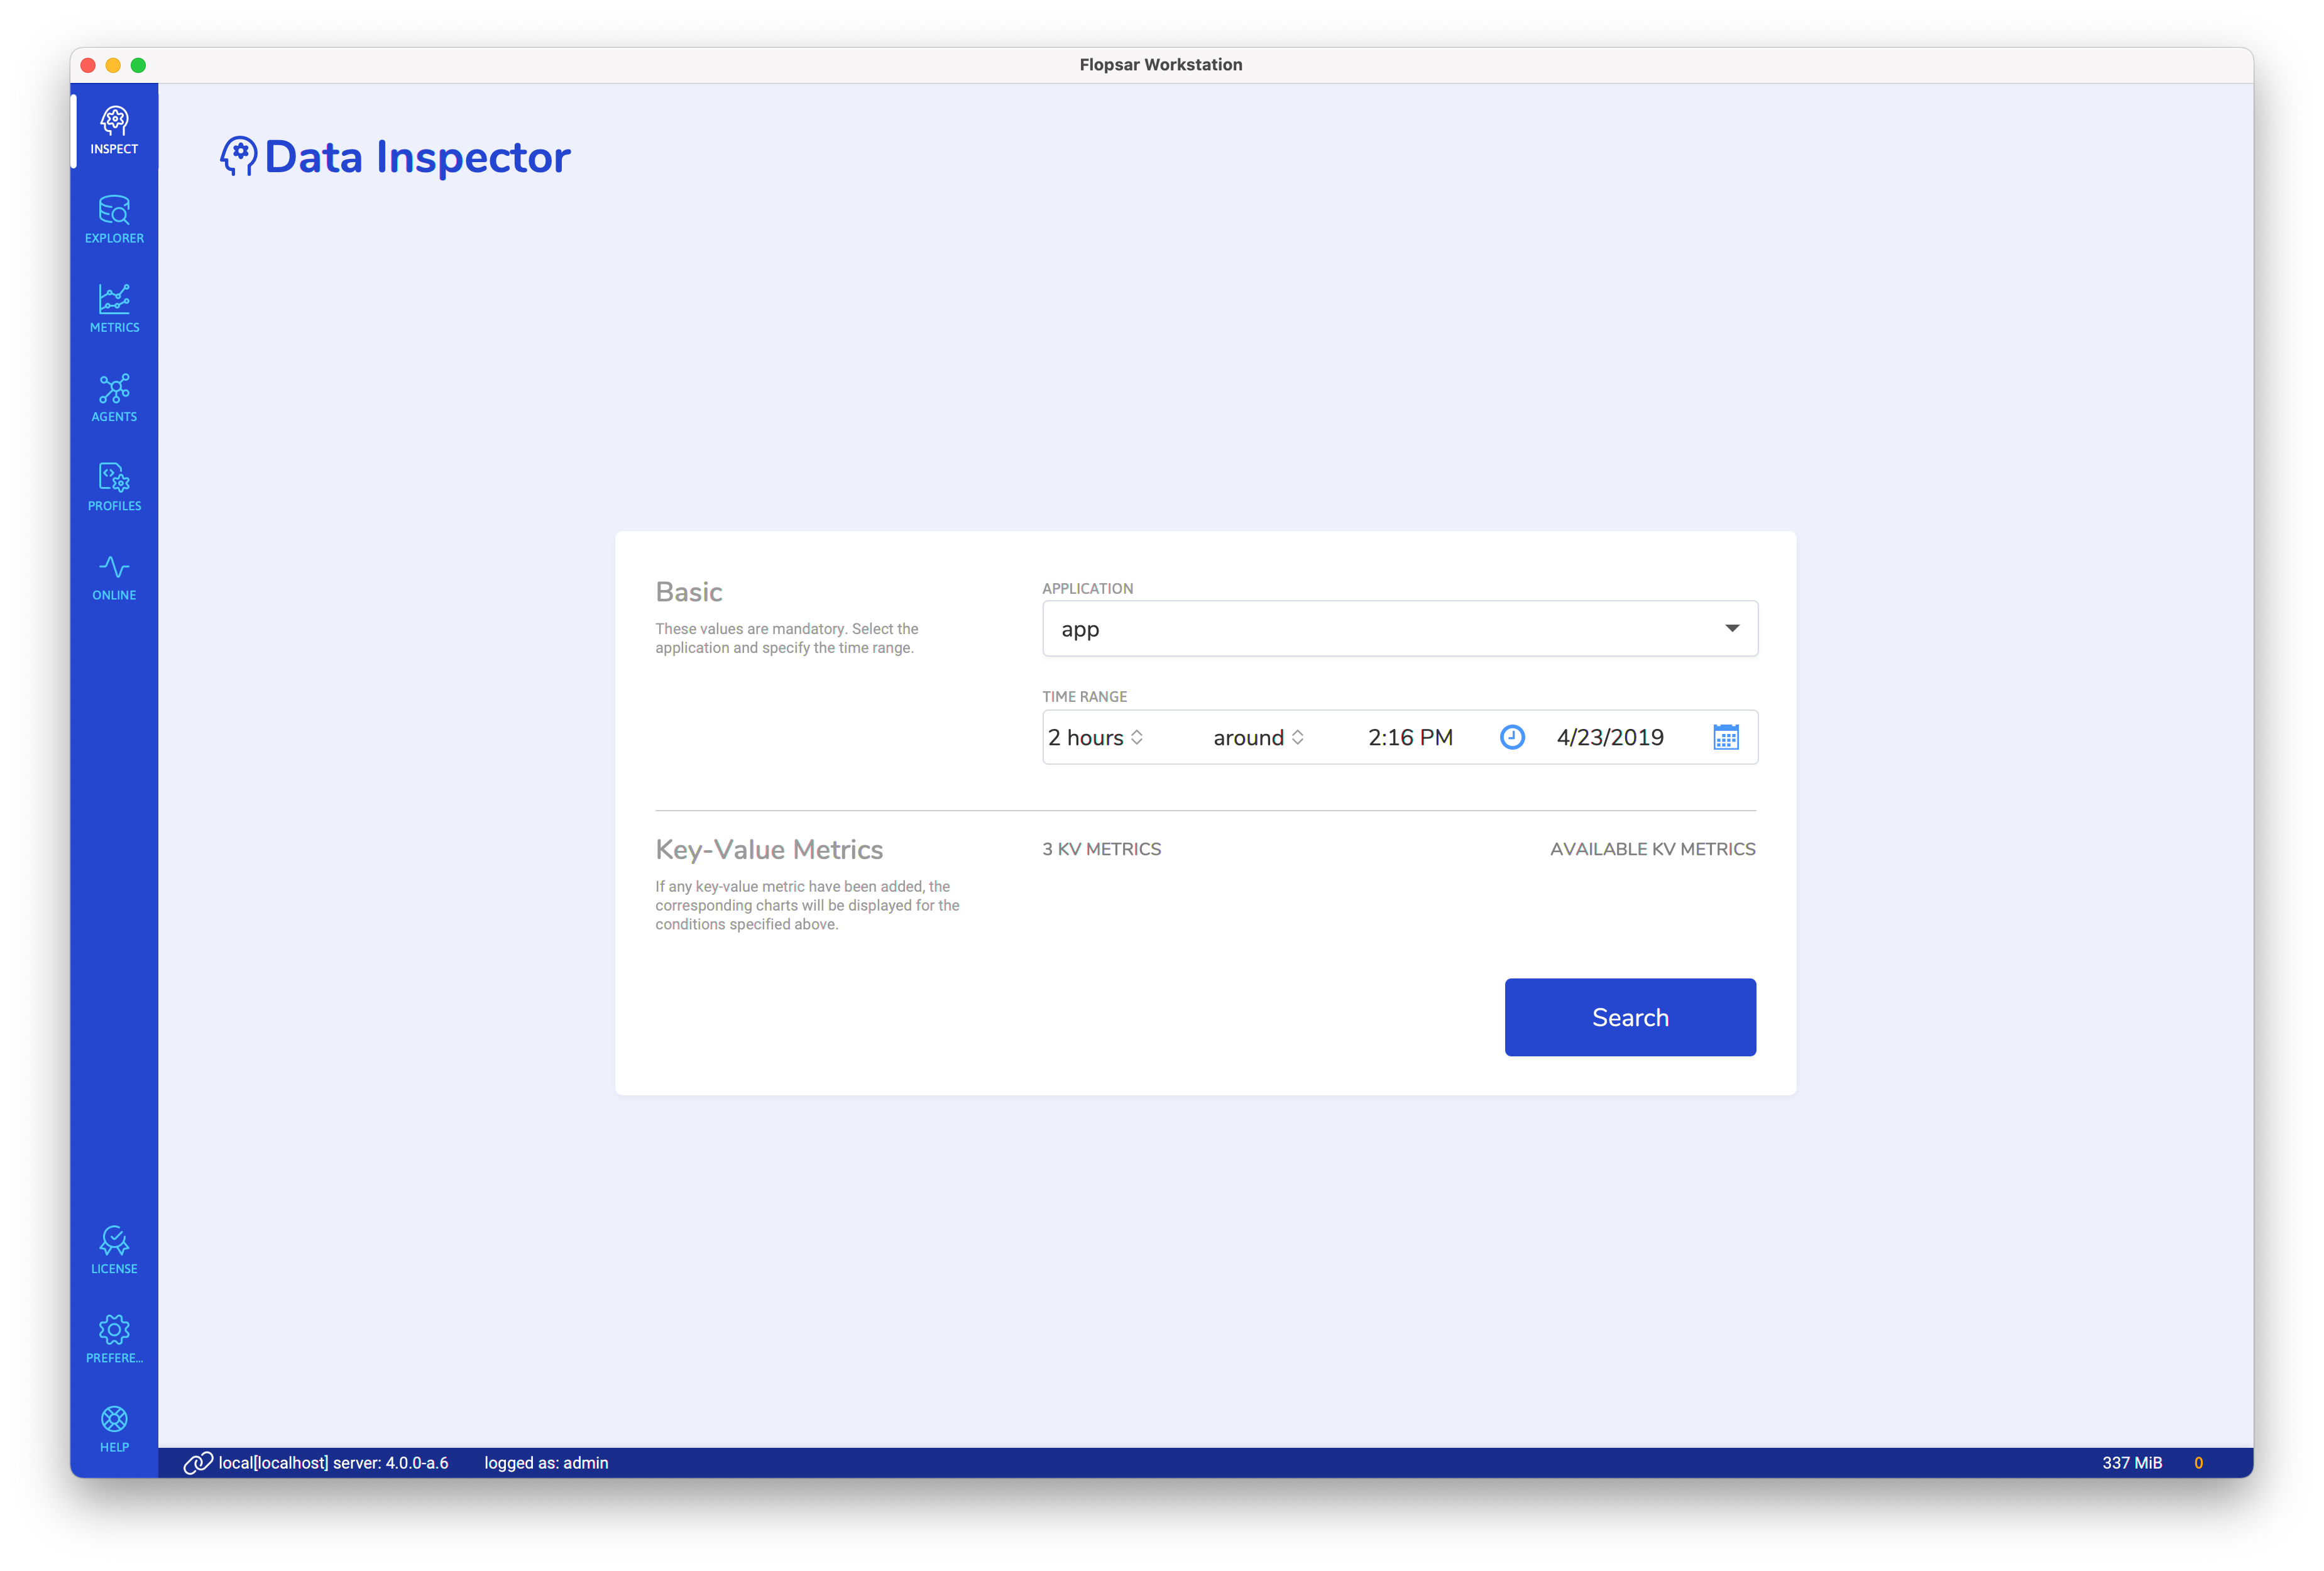
This is a special view, which makes an analysis of your application performance much easier. In order to run it, you need to fill out the form below. Besides the methods execution analysis, you can also add some key-value metrics, which will be presented in the same resulting view. This is the fastest way to analyze your application since all you have to do is select the application and specify the time range.
Search Form
Key-Value Metrics
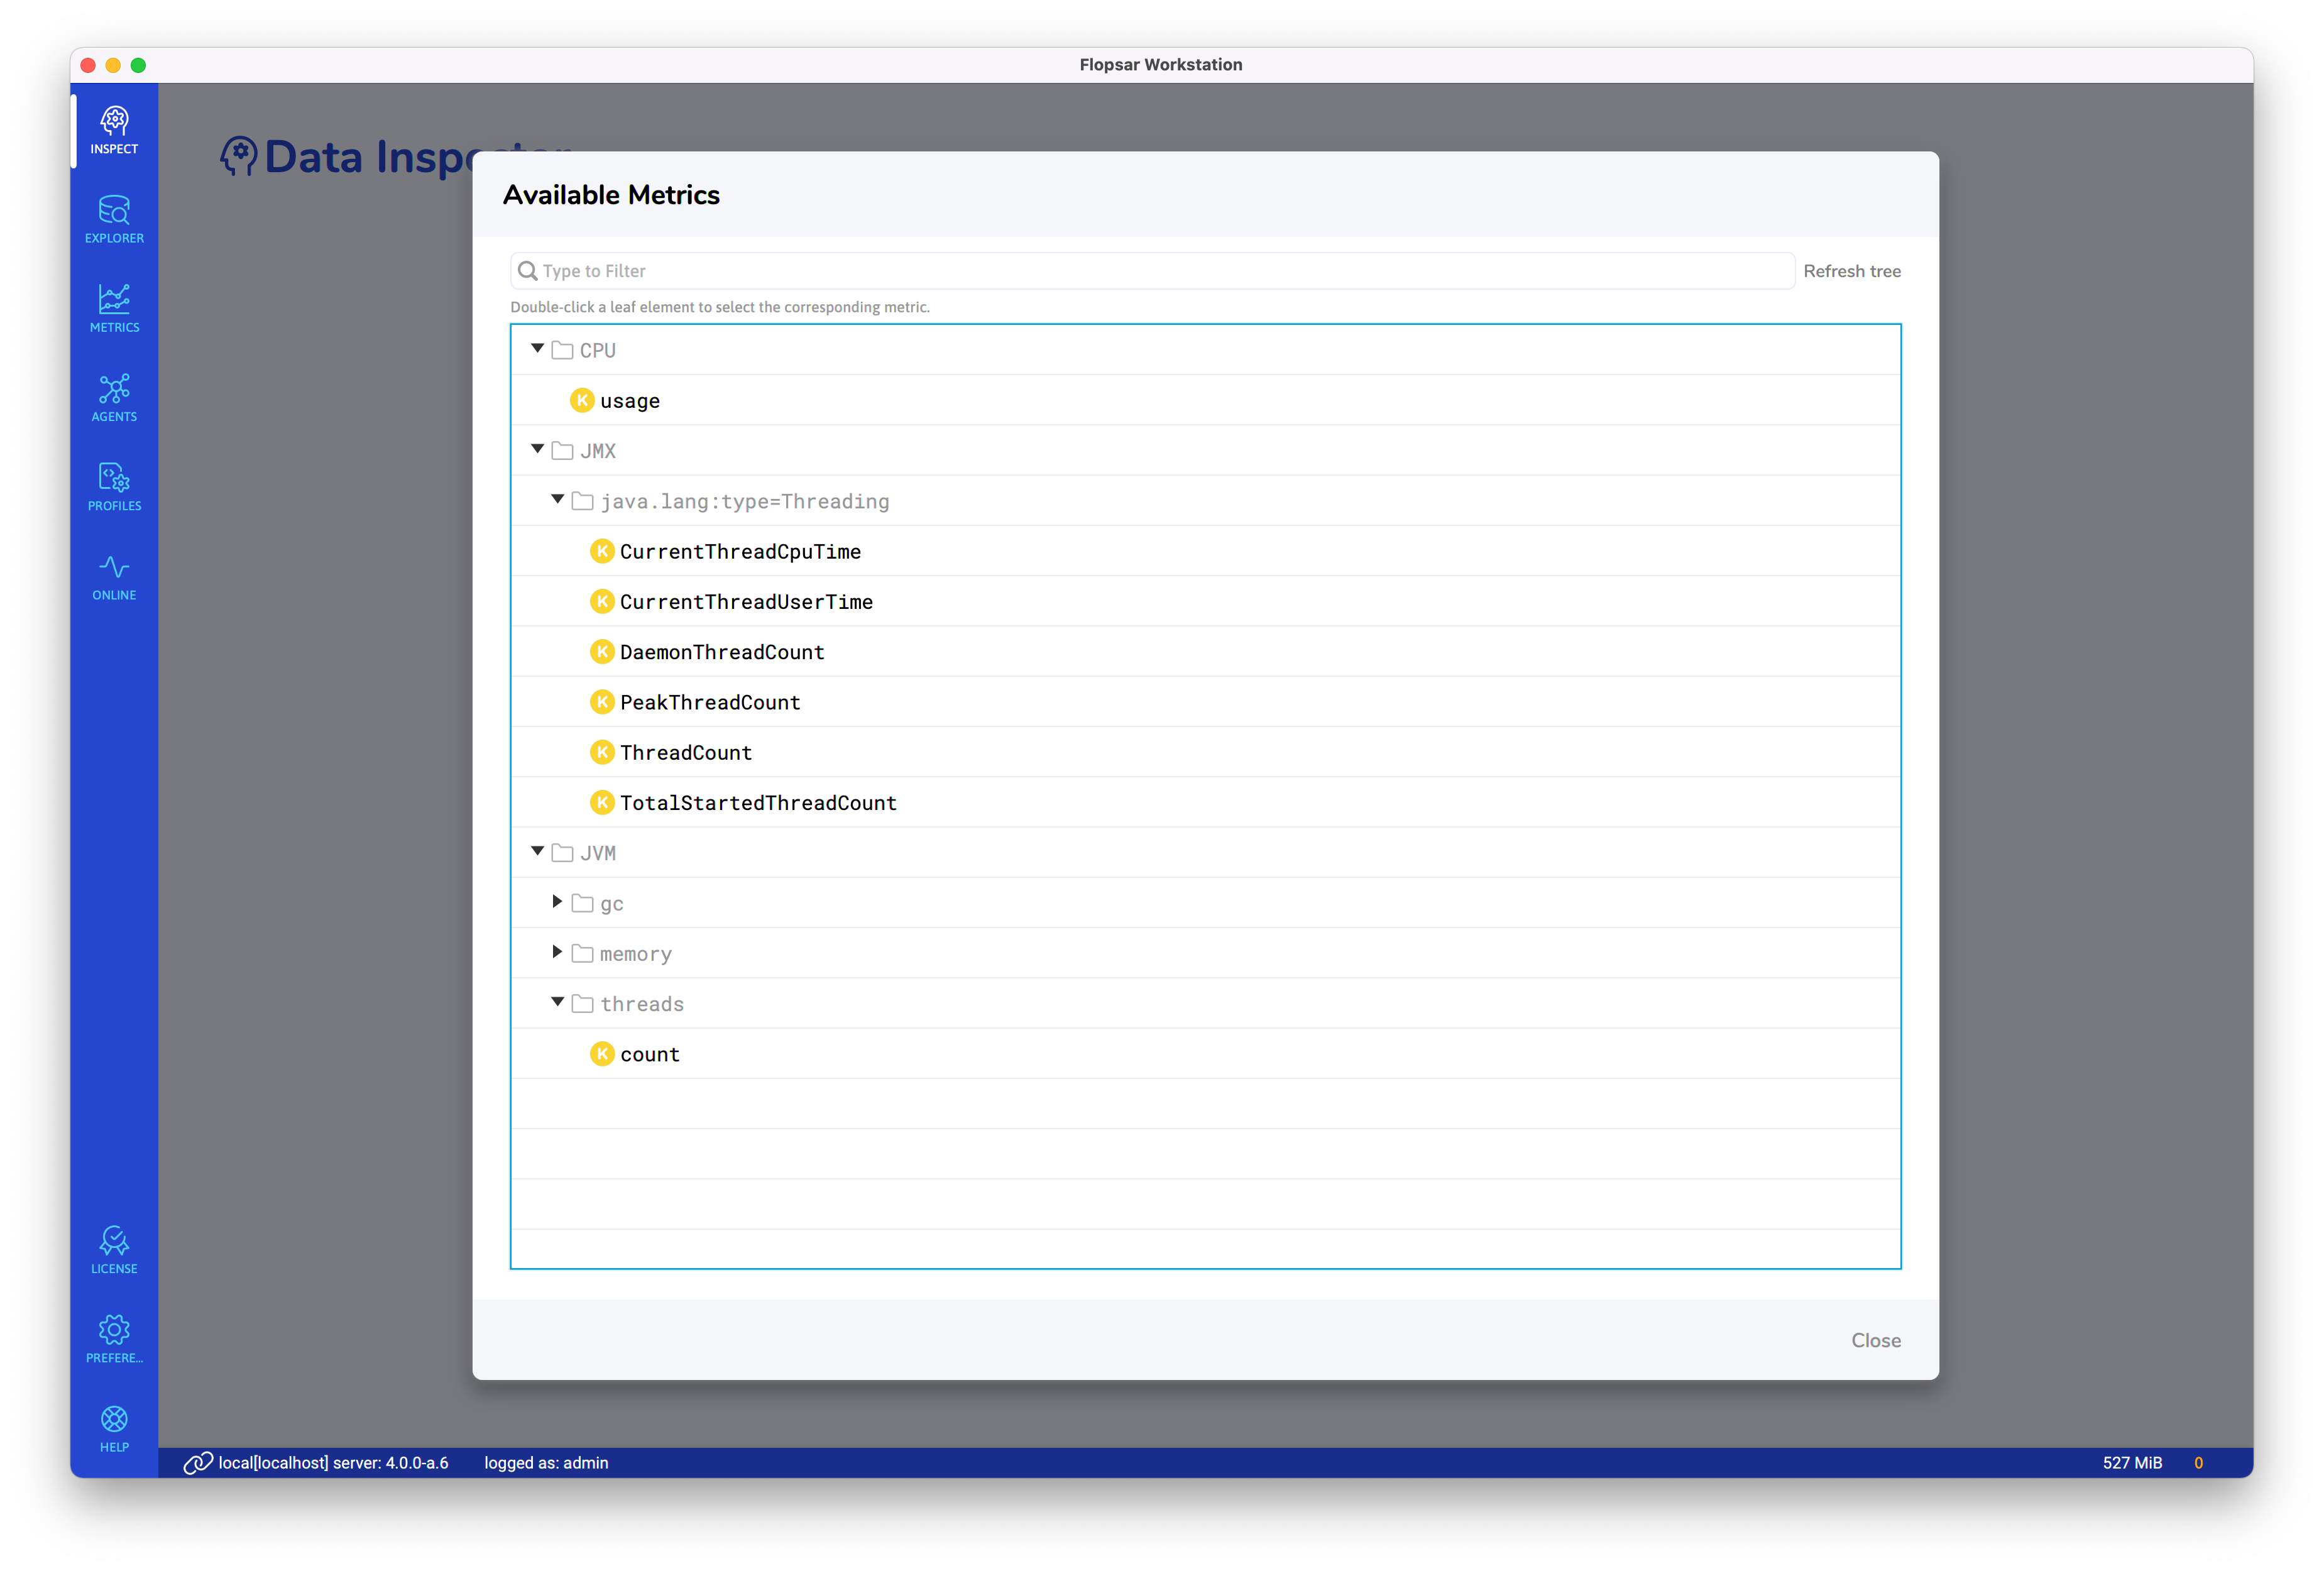
If you want to add to your search some key-value metrics, just click the AVAILABLE KV METRICS link and select the metrics from the tree.
All the selected metrics are stored locally, in your workstation. You can access these metrics by clicking the KV METRICS link.
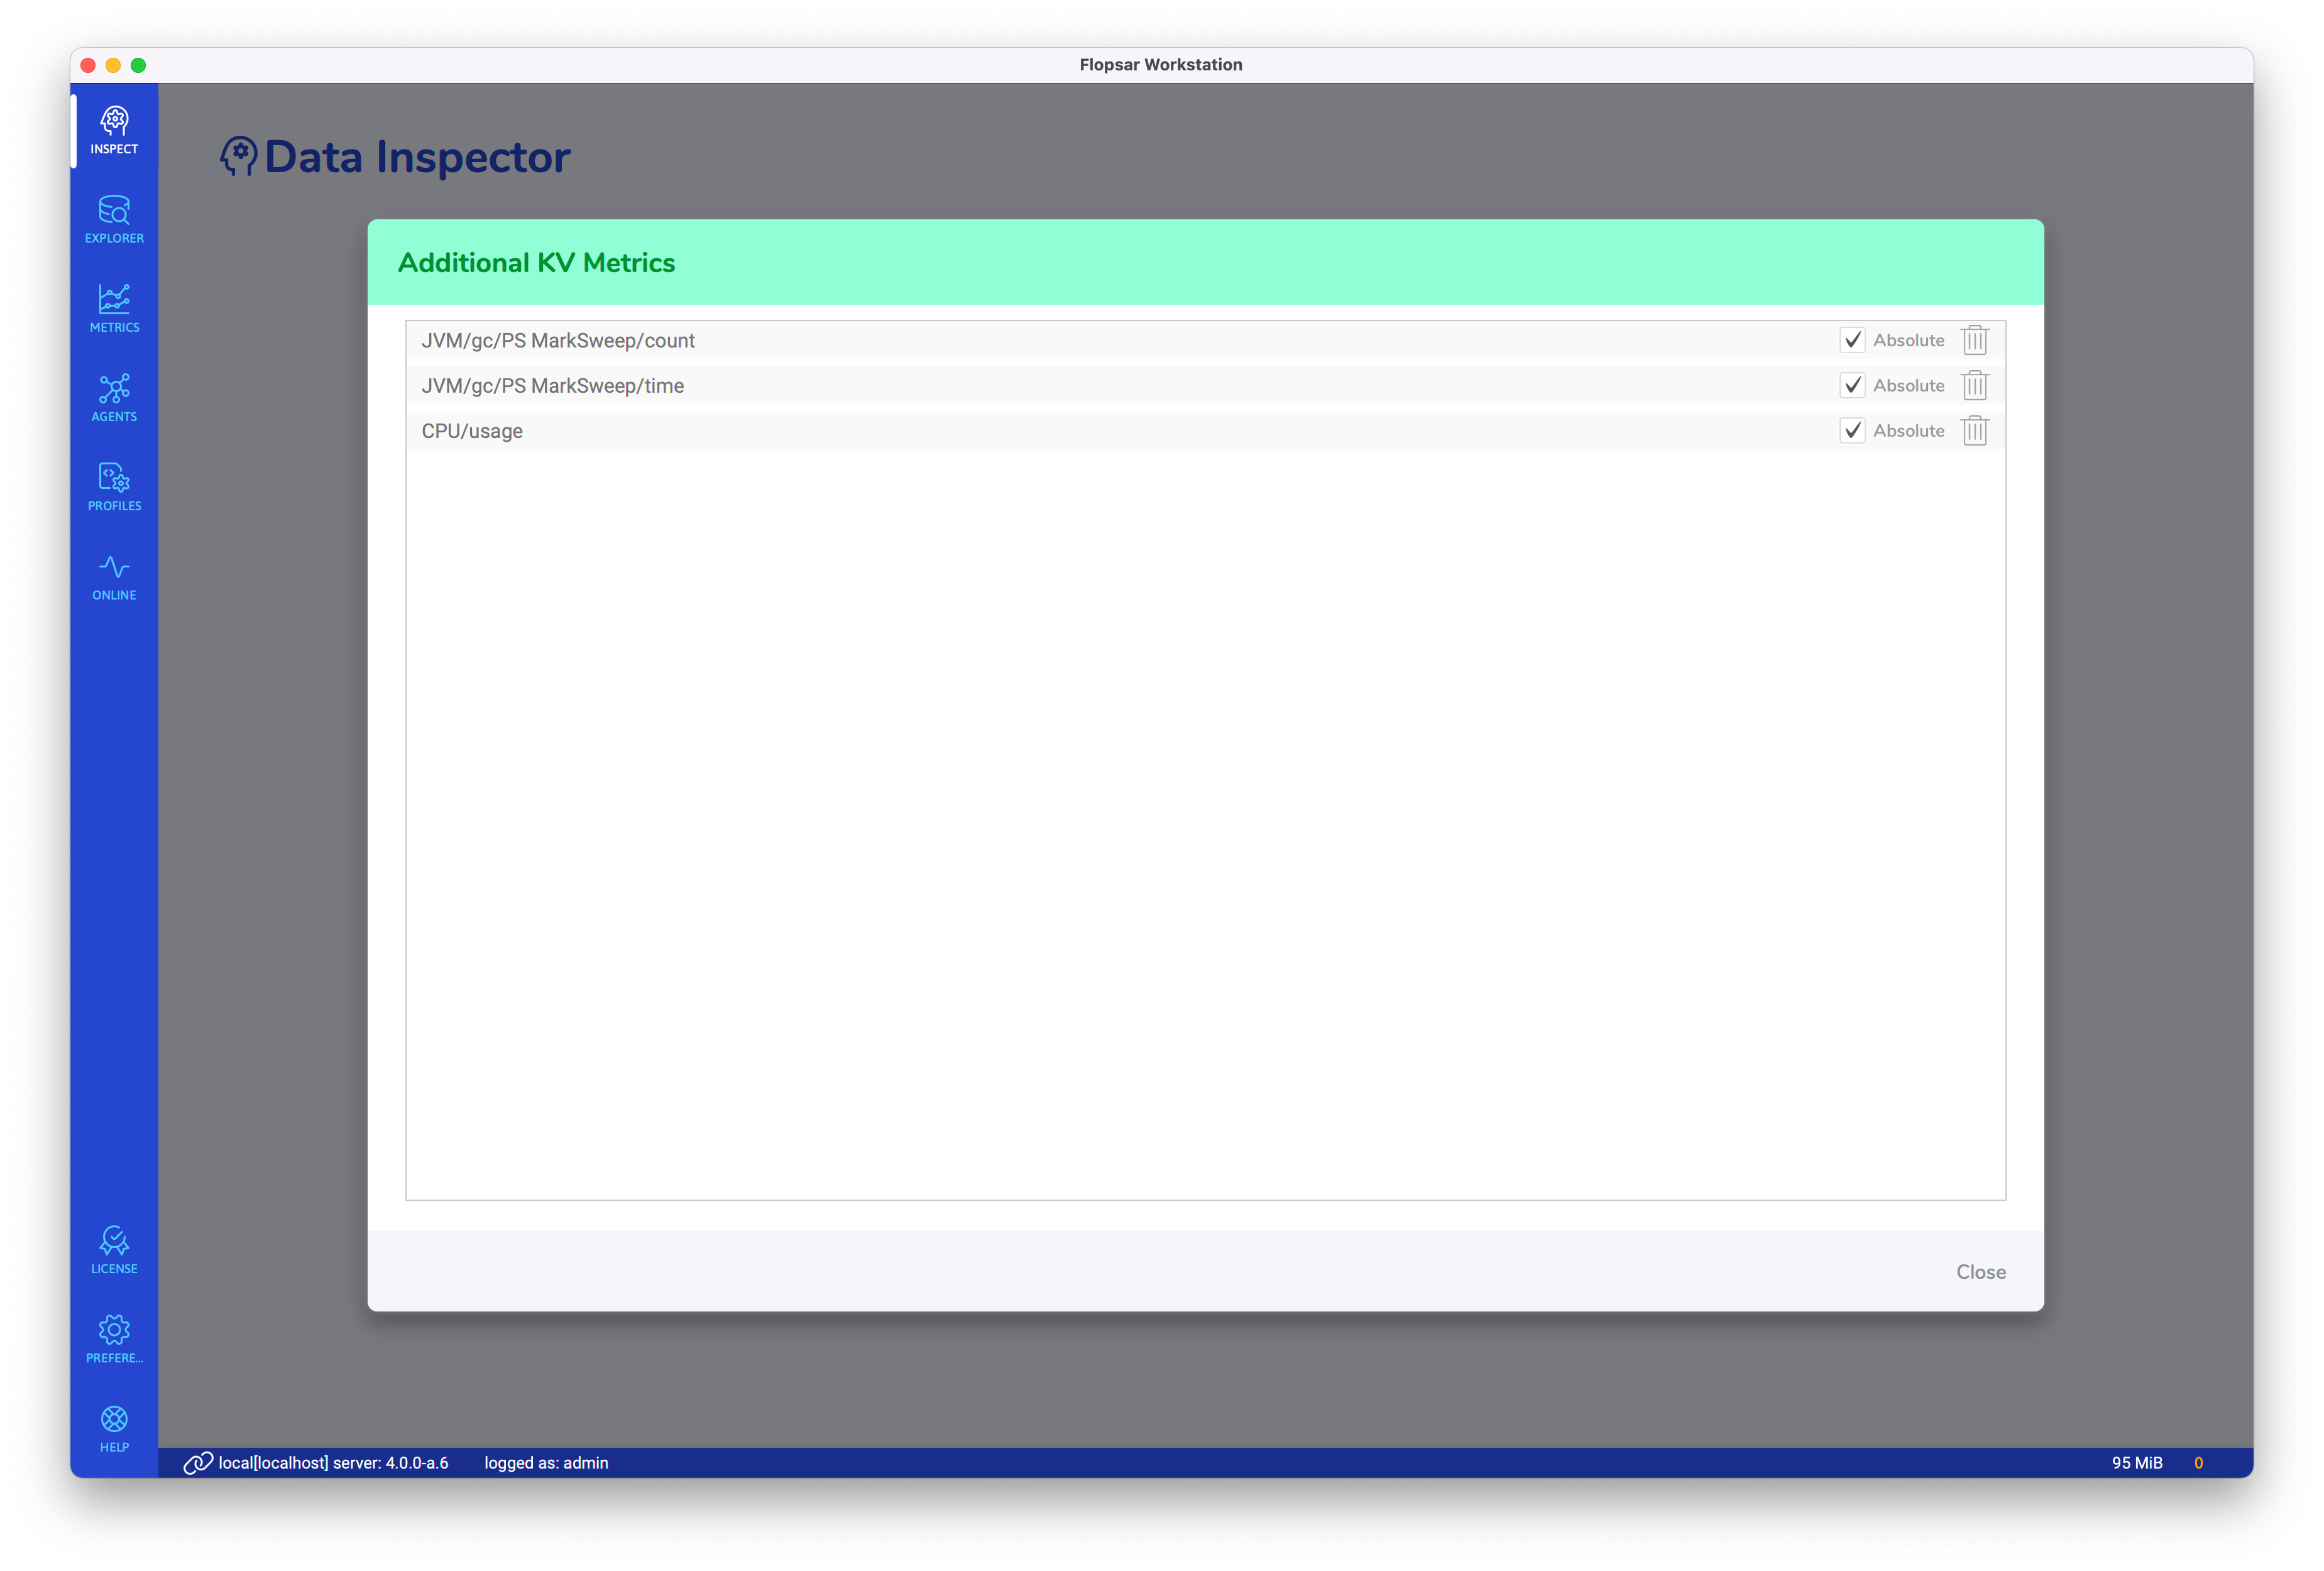
You can manage your metrics in the view above.
Results
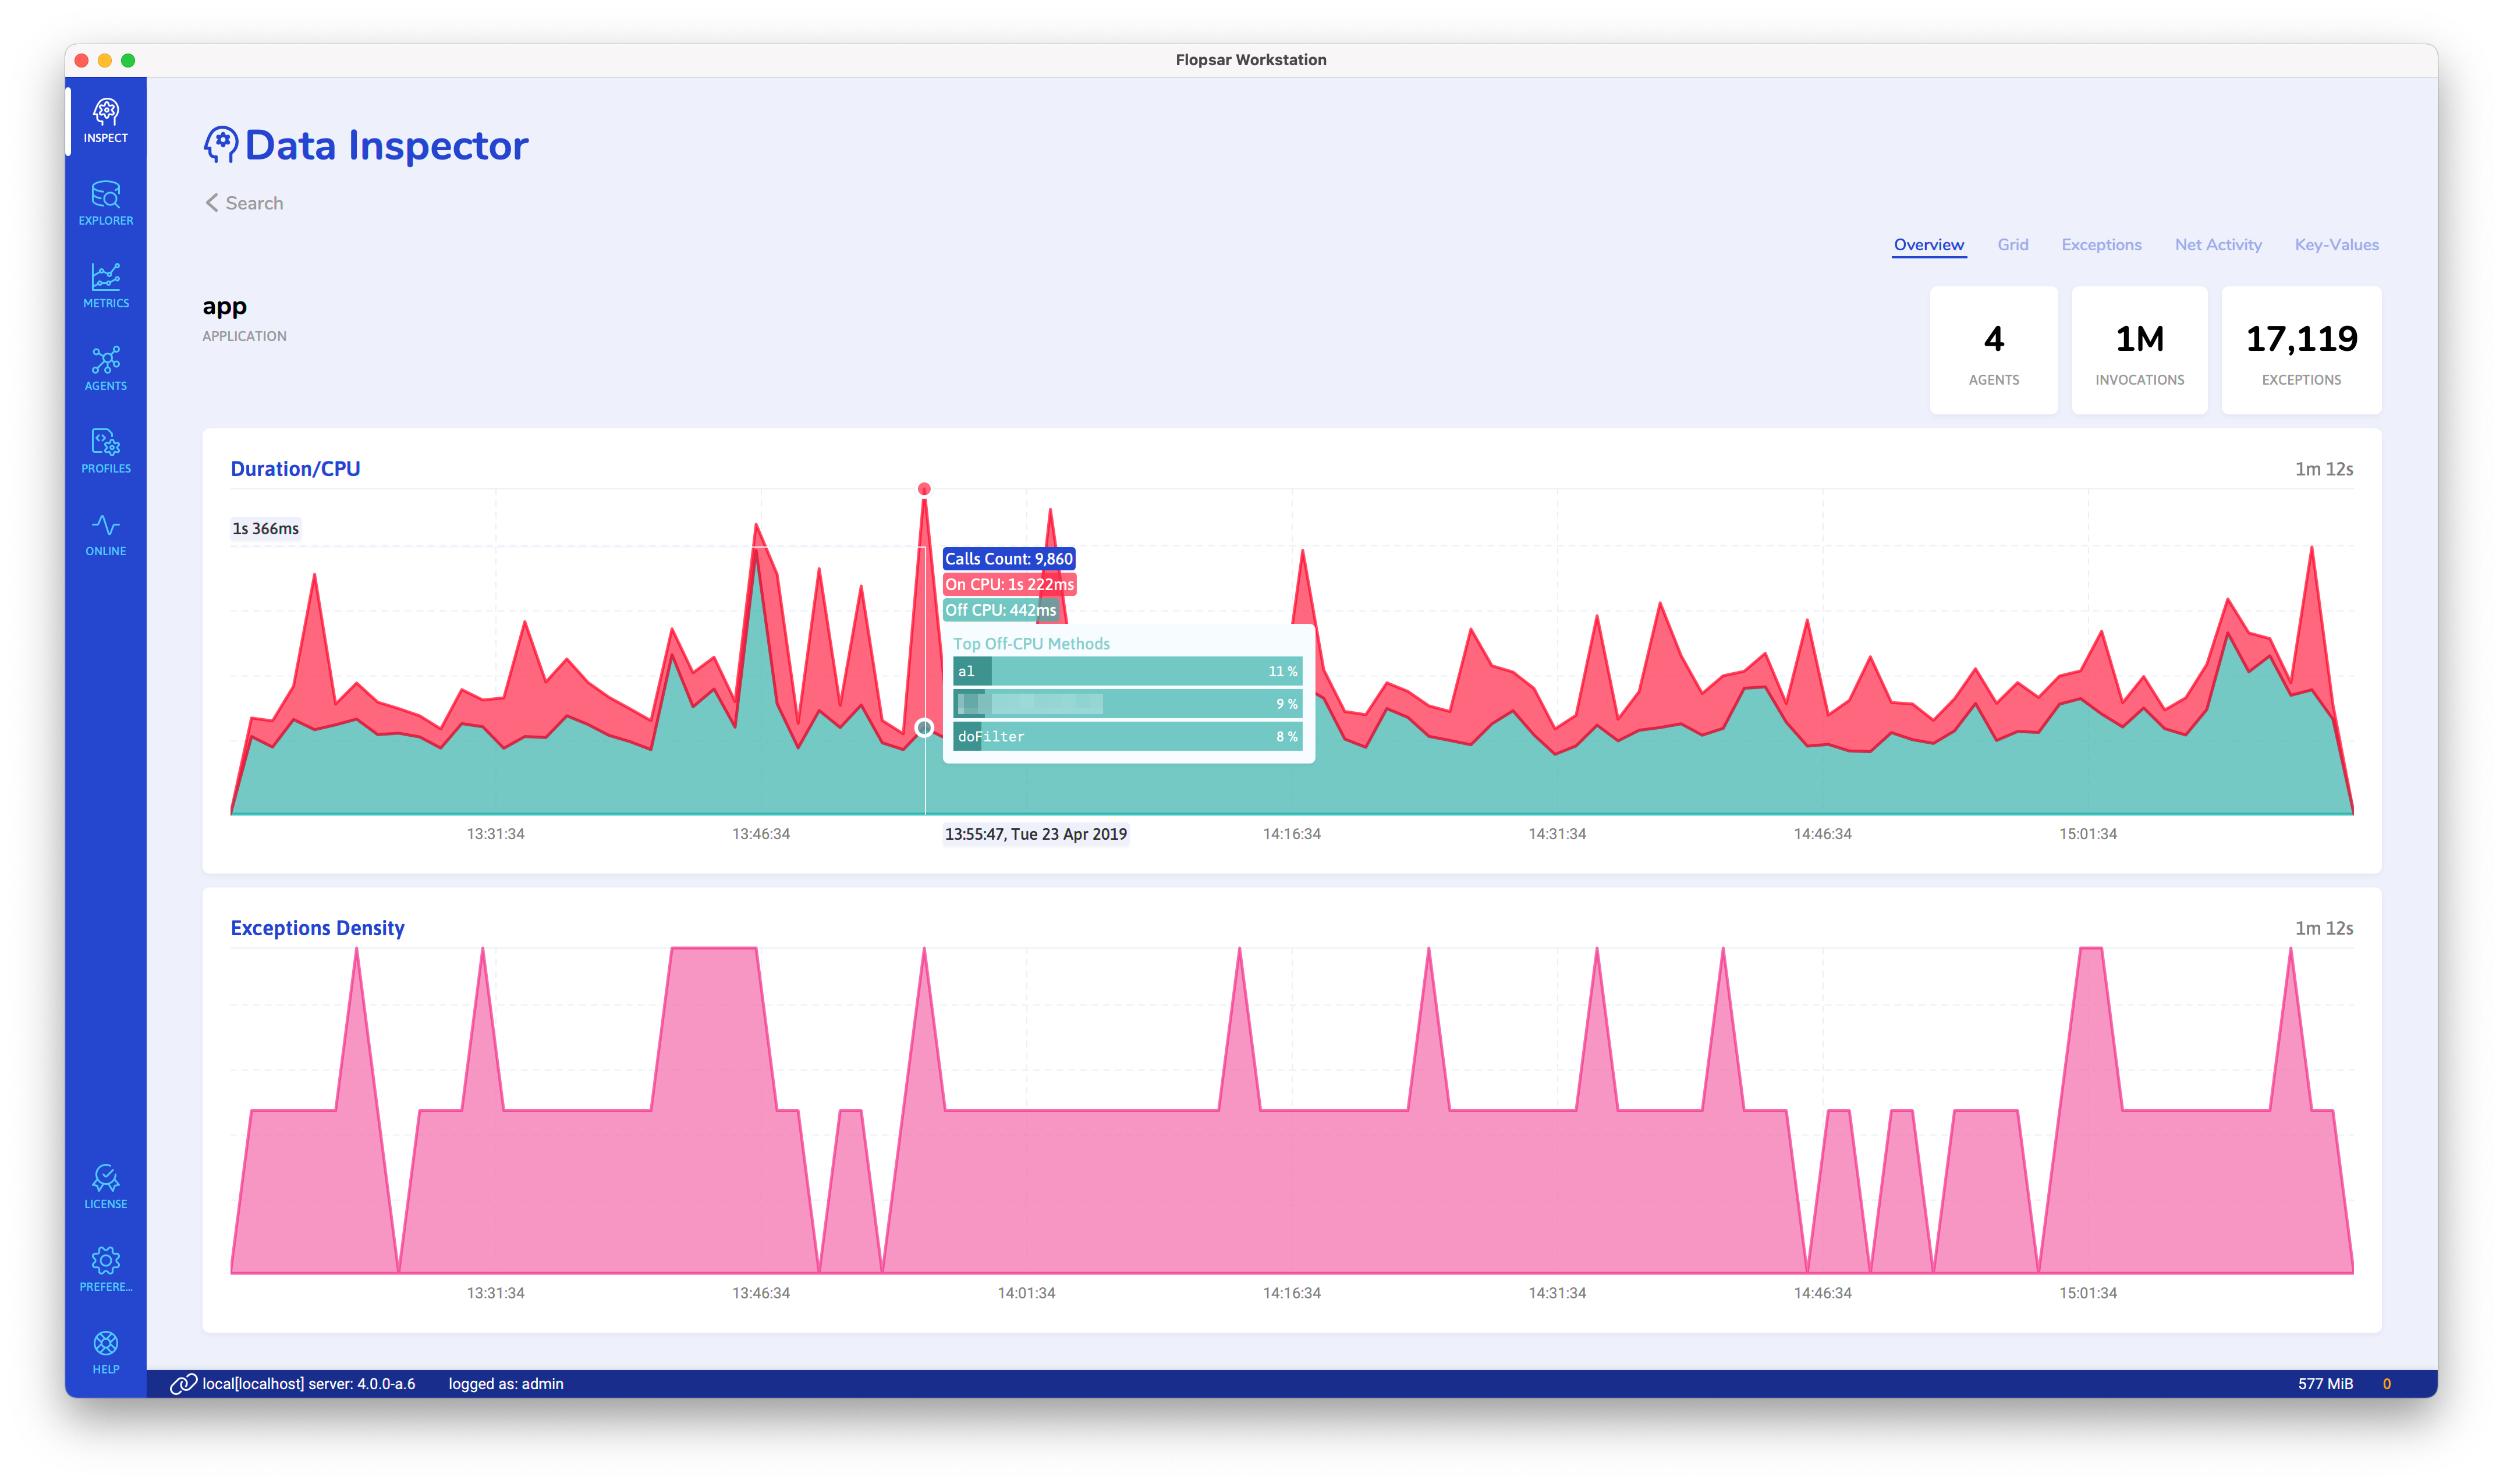
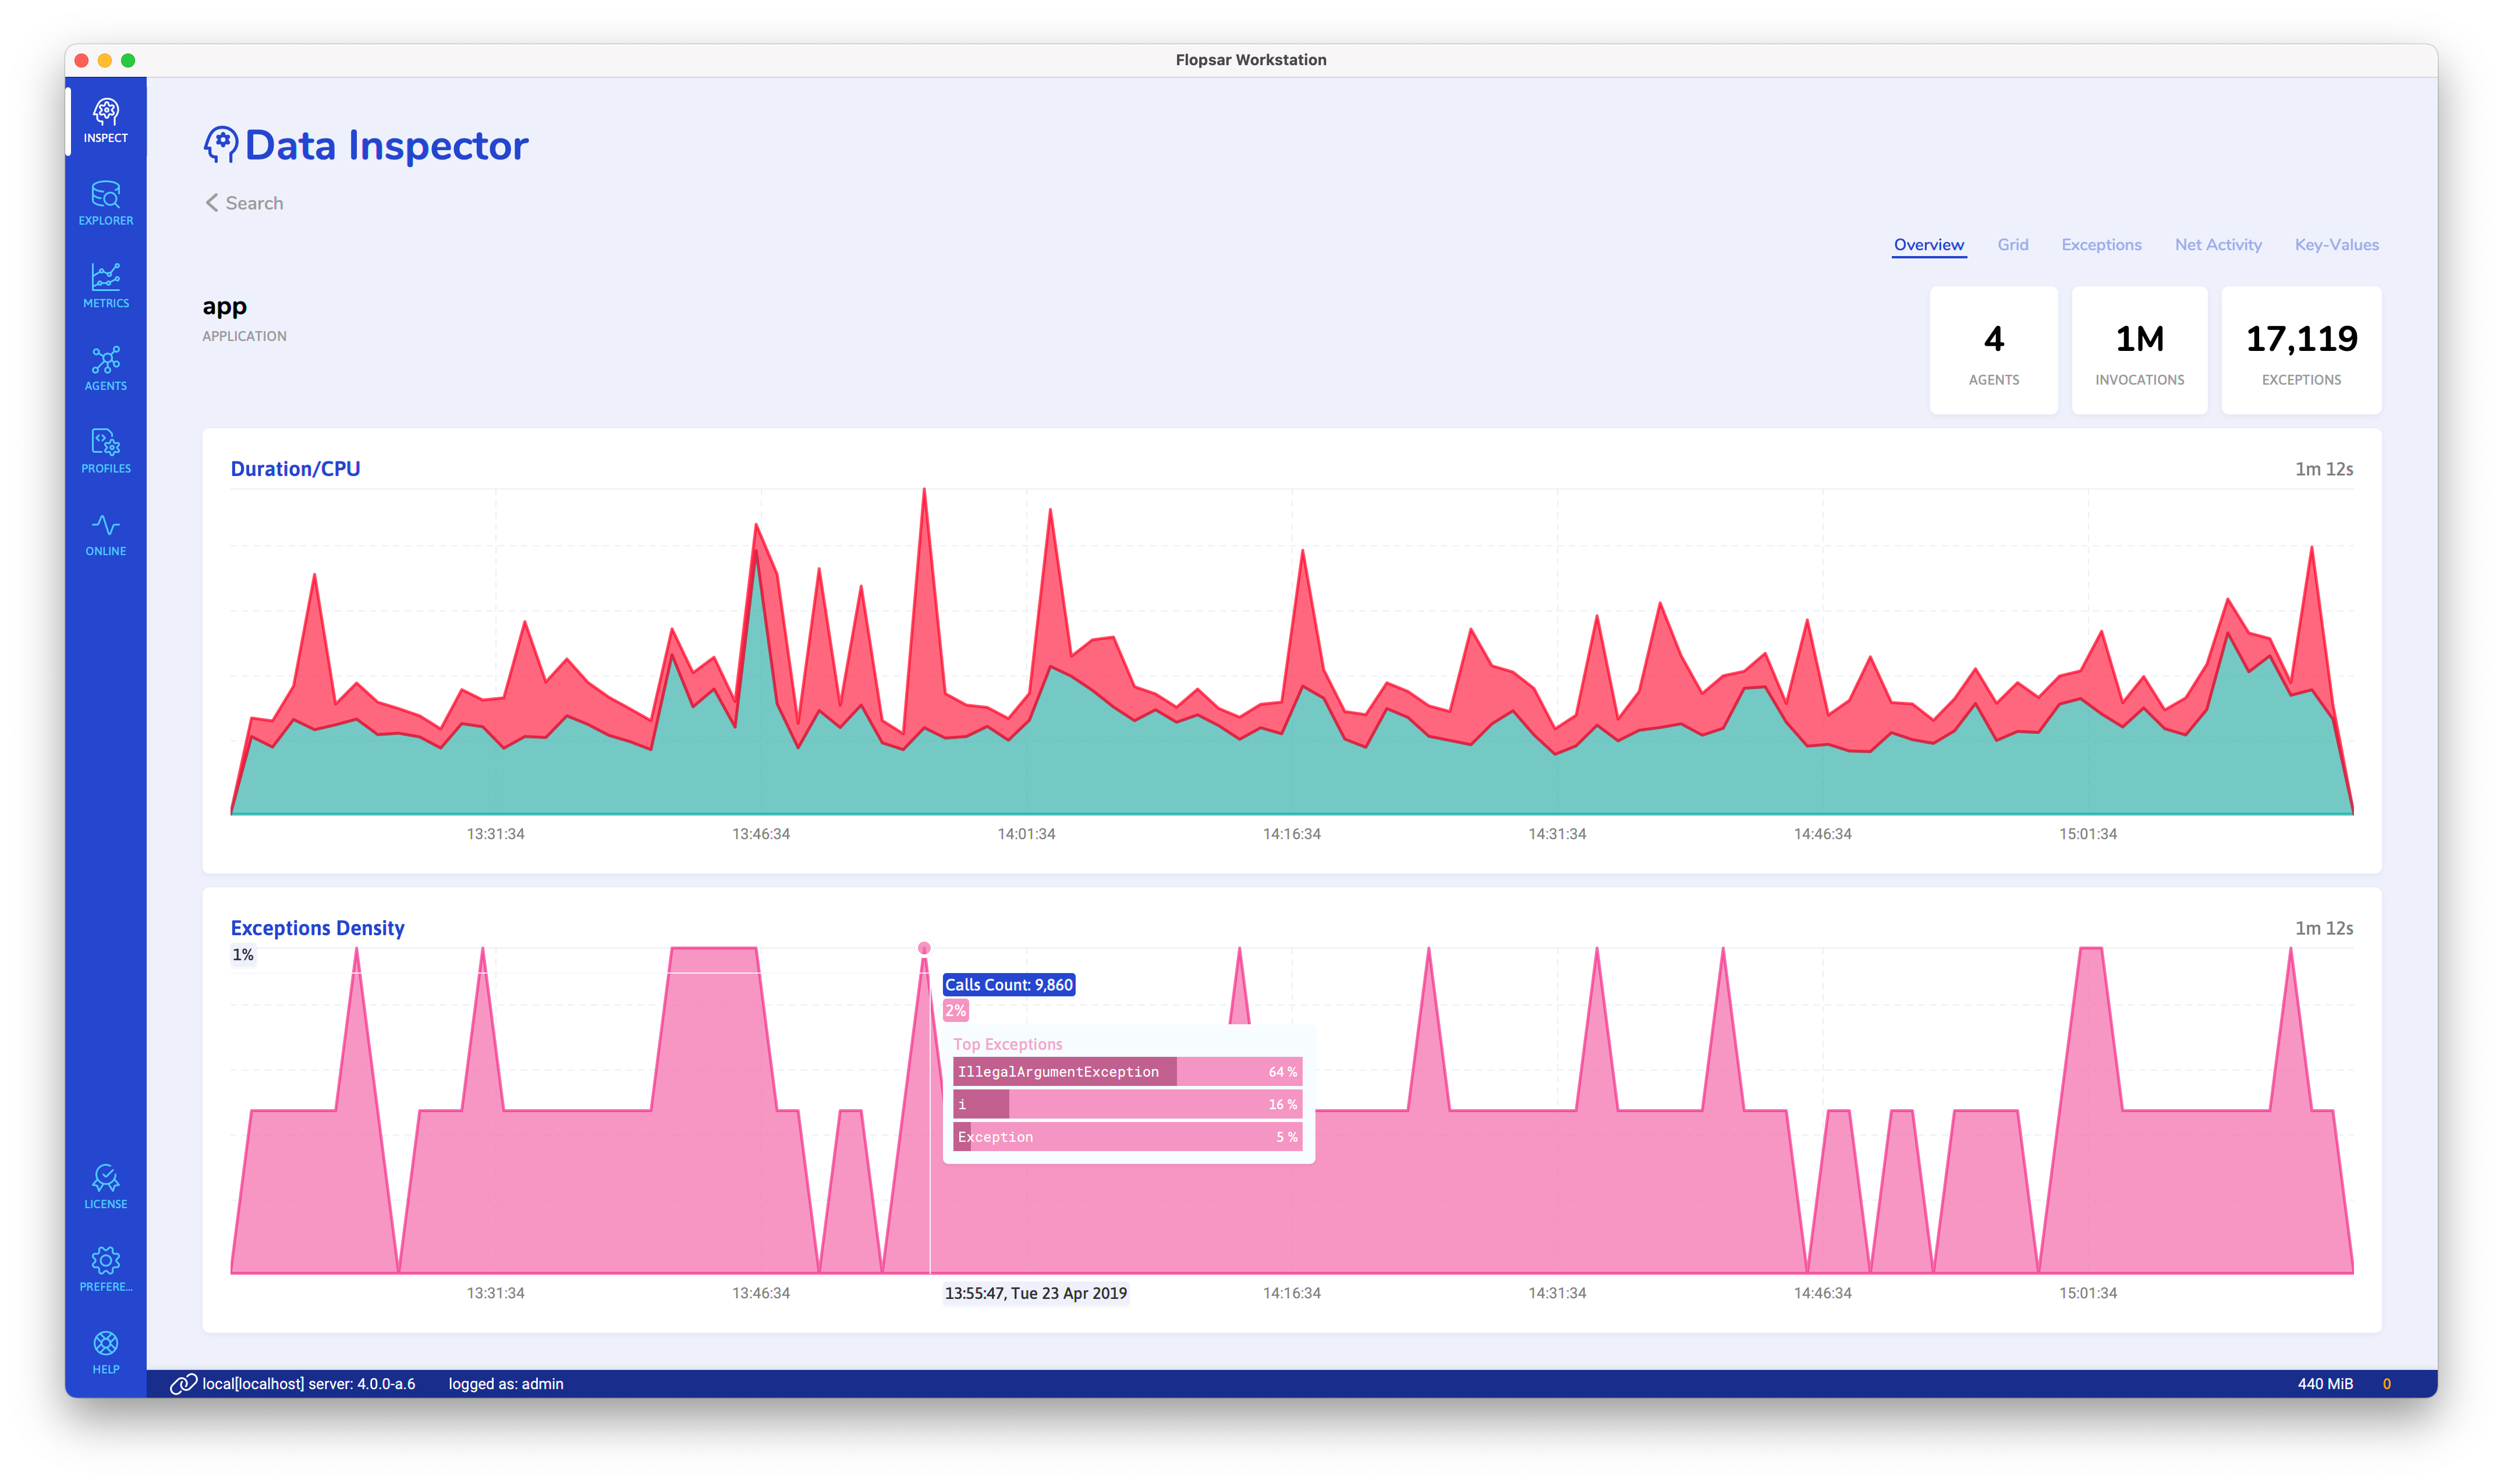
As a result of the data inspector, you will get a result similar to the one below.
Overview
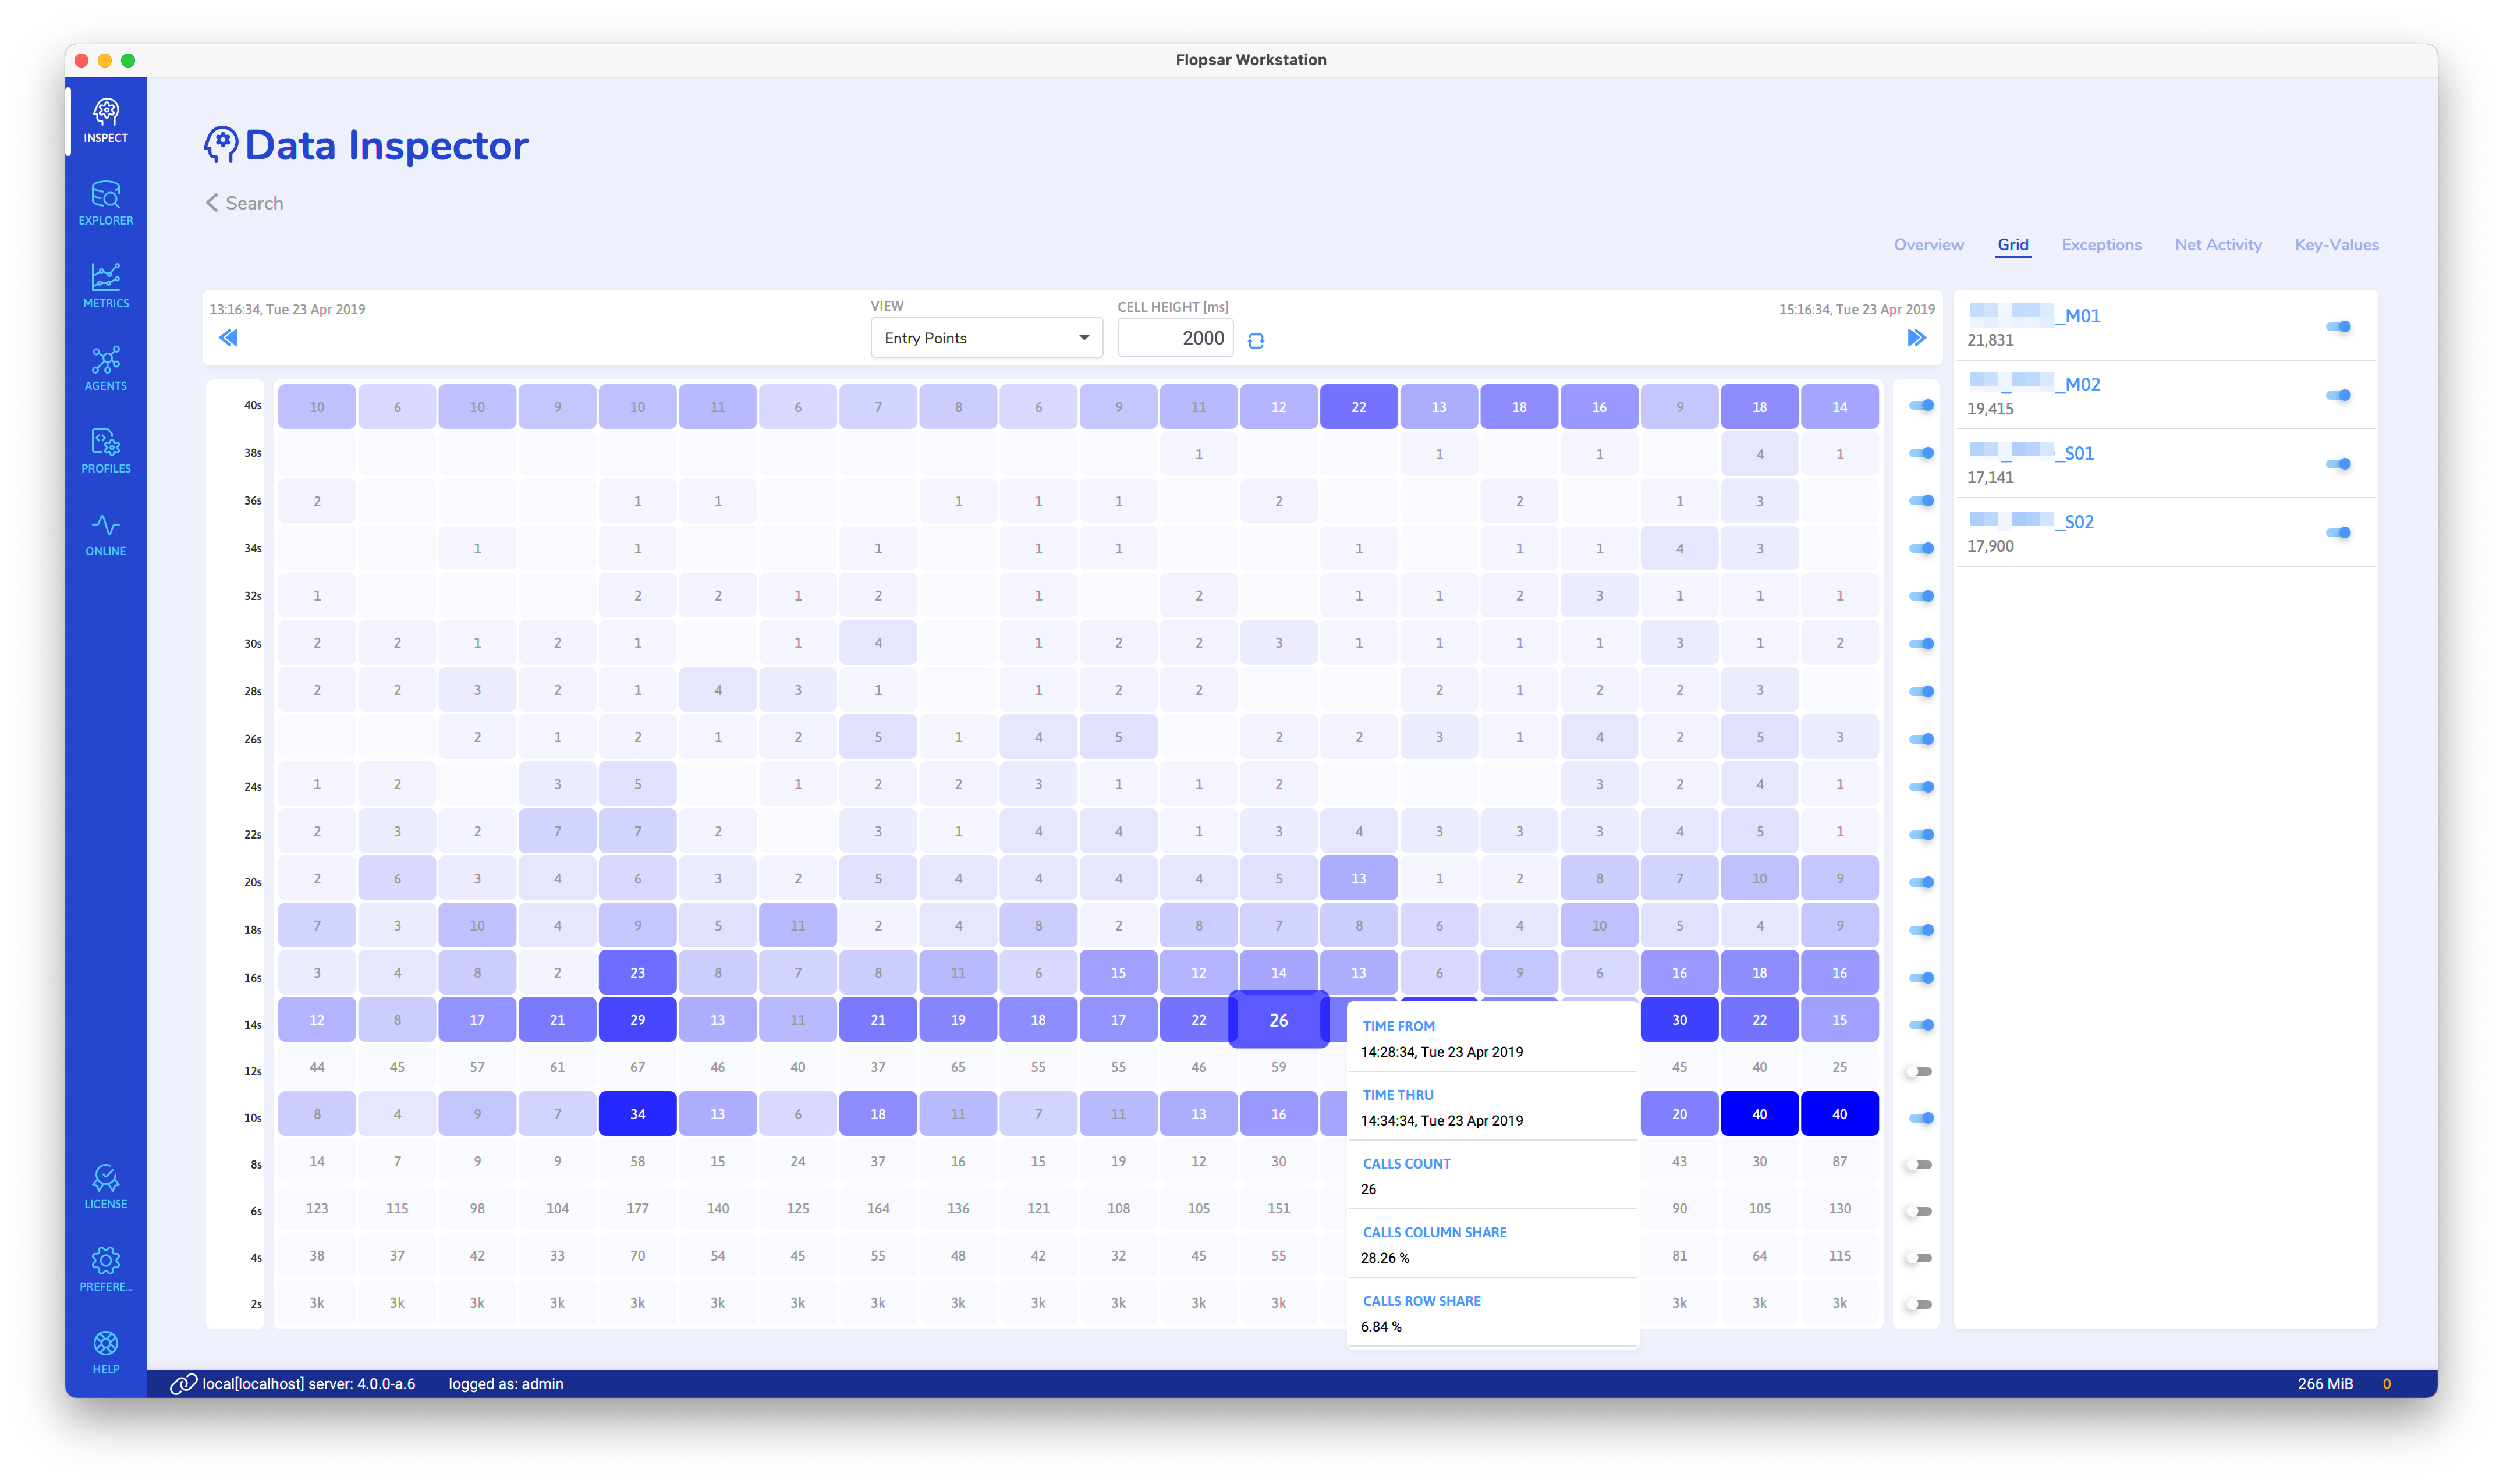
Grid
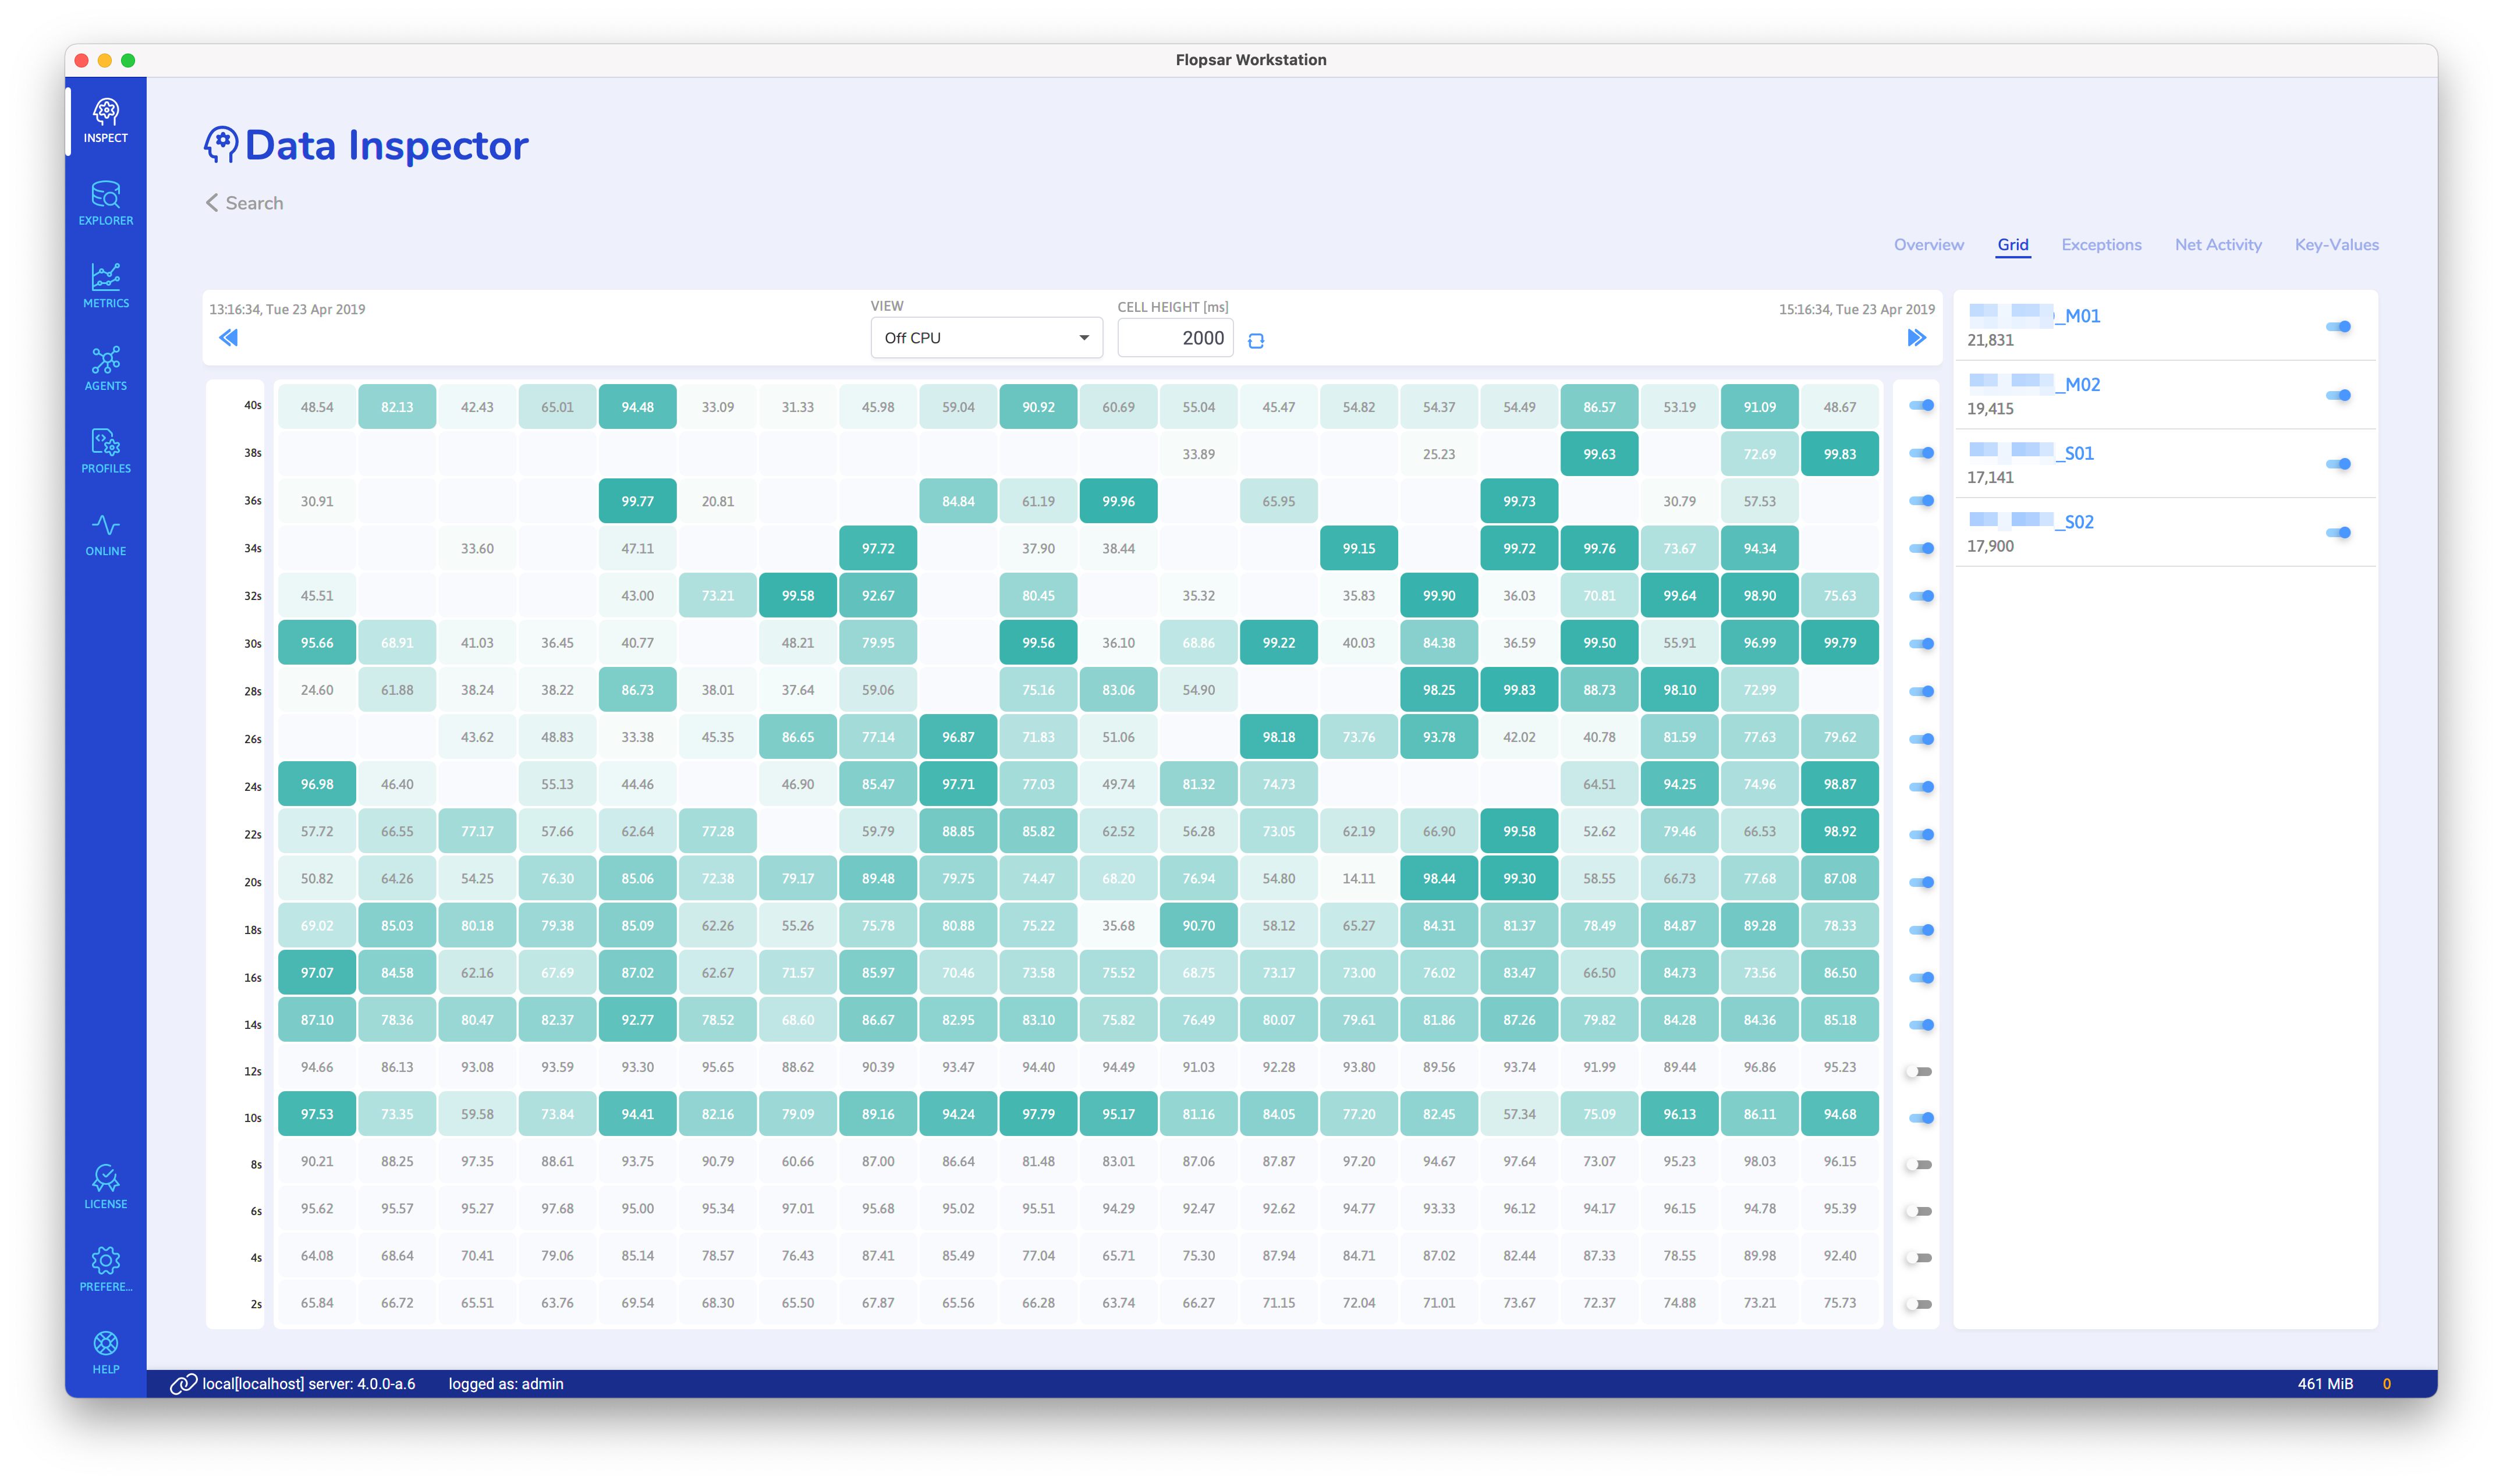
This view presents a grid of cells, which aggregates some specific values. In order to choose which values should be displayed, you need to select one of the options in the View combo box. By default, it presents the entry points view.
Each cell represents a collection of methods' calls. Its width represents a time range, which is calculated as a quotient of the query total time range and the number of cells in a single row (which is 20). The cell height represents a duration range, which is specified in the CELL HEIGHT field. You can change this value (in milliseconds) by updating the field and clicking the reload button. There are two special rows in the grid: the bottom and top ones. The bottom row aggregates all methods' calls, which duration is less than the CELL HEIGHT value. For any next row, the duration is added to the previous row until the last one. The top row aggregates all the remaining methods' calls.
Entry Points
Each cell contains a number in its center. This number value represents the number of methods' calls aggregated in the cell. The cell background opacity is a qualitative representation of a ratio of the number of methods calls in the cell and the total number of methods calls.
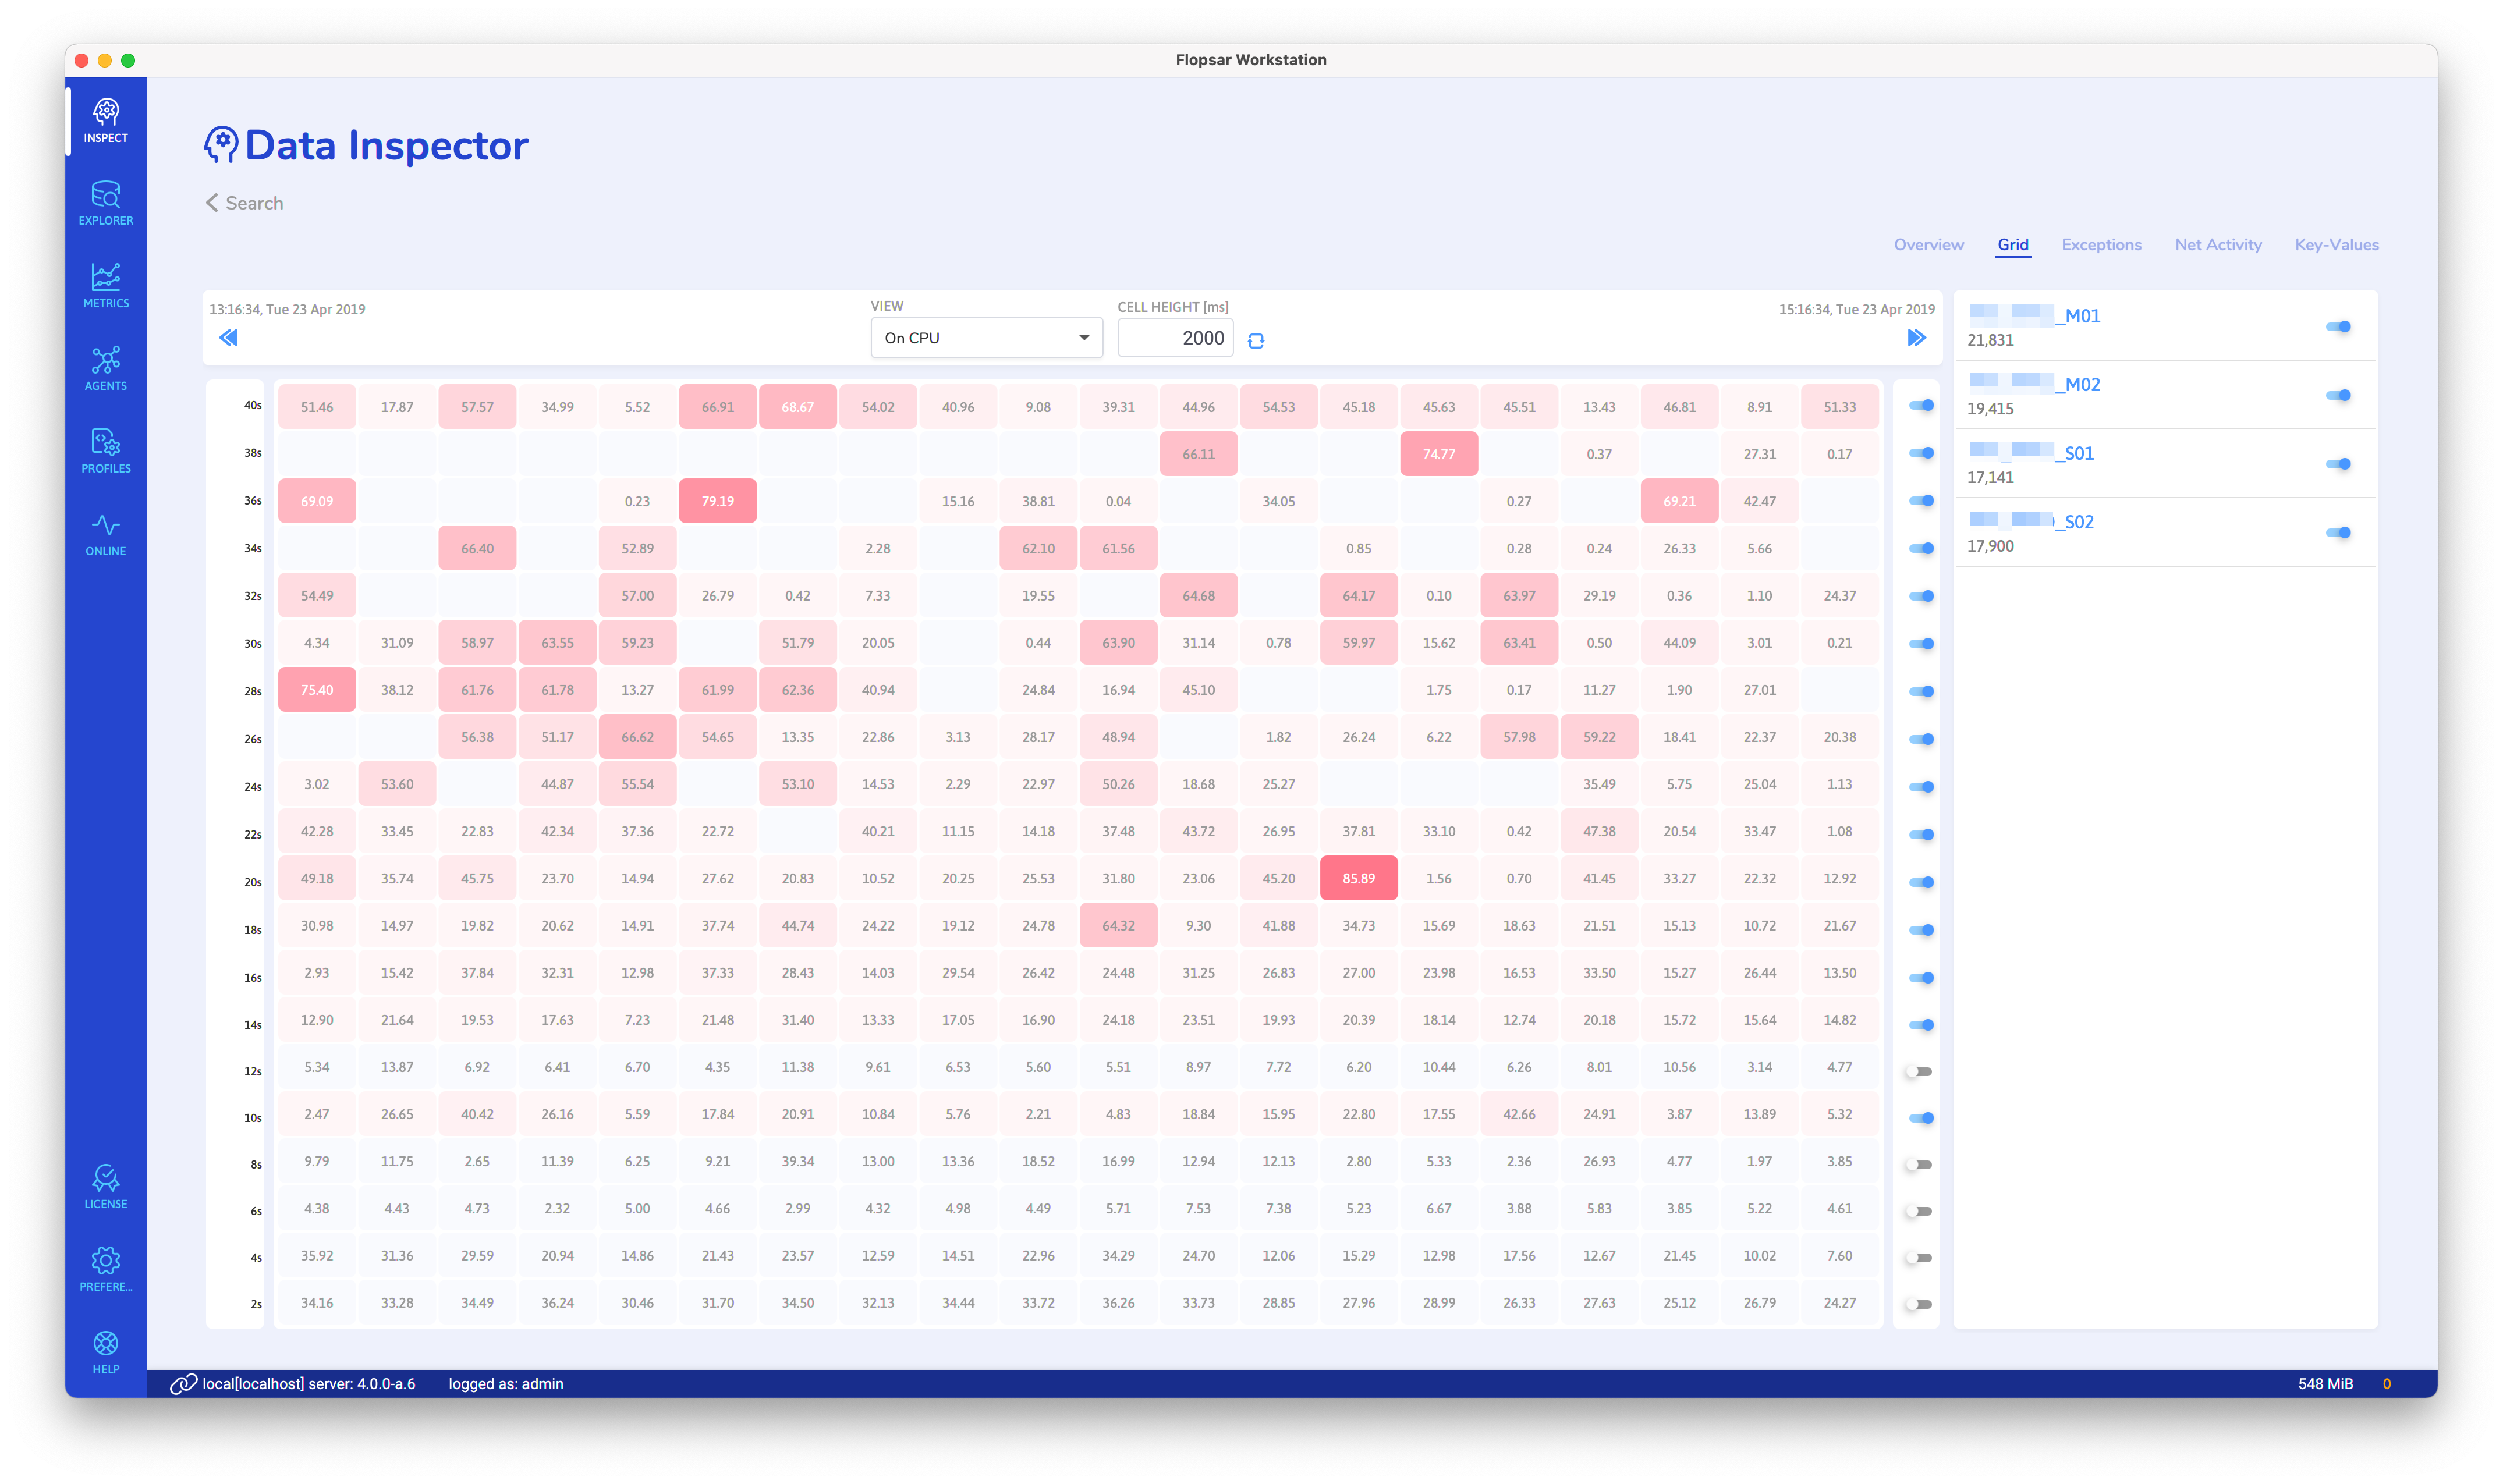
On CPU
Off CPU
Exceptions
This view presents all the exceptions thrown in the methods, which satisfy your search filter. The exceptions are presented in a form of a list. Each record has two values, which both denote the number of exceptions thrown. The number with a red, flash icon represents how many exceptions have been thrown at the entry point level. The number with a gray, flash icon represents the total number of the thrown exceptions.
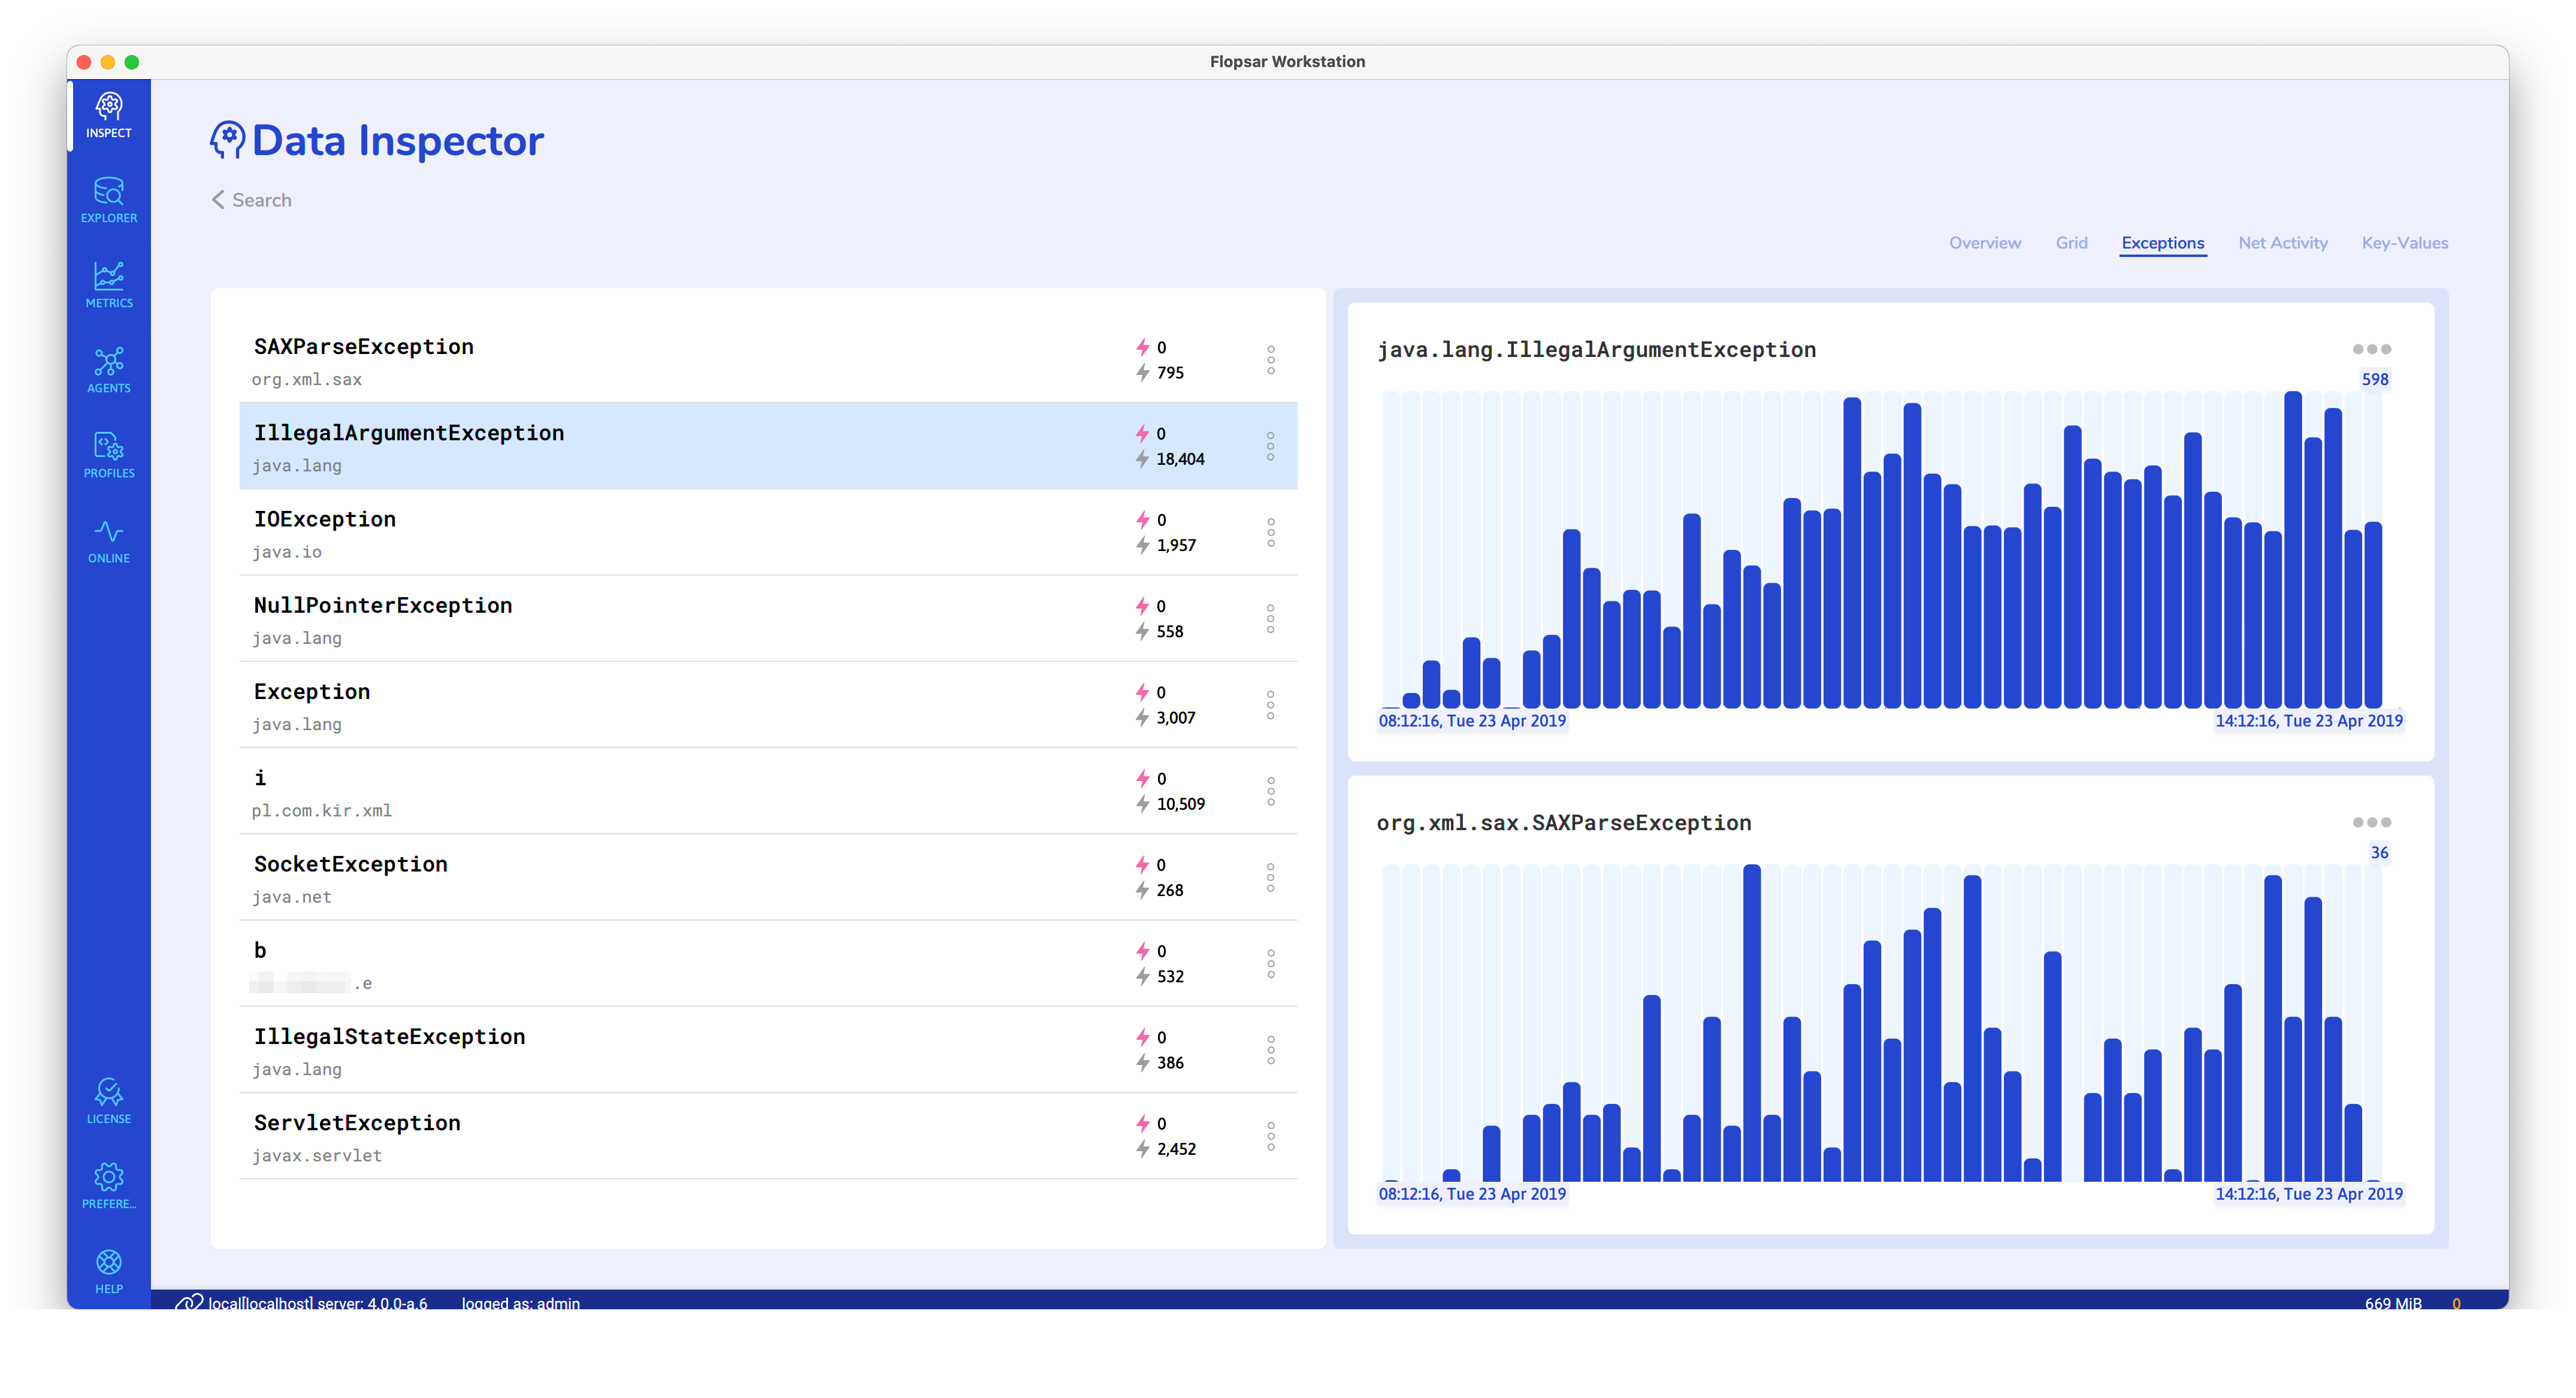
Each record has an action menu, which can be used to further investigate the exceptions. There are three actions you can use to analyze the time occurrences of the selected exception, entry points that have thrown the exception, and unique stack traces of the exception.
Occurrences Time Histogram
If you click the Occurrences Time Histogram menu item, you will get a histogram of the selected exception. The histogram will be displayed on the right side of the exception list.
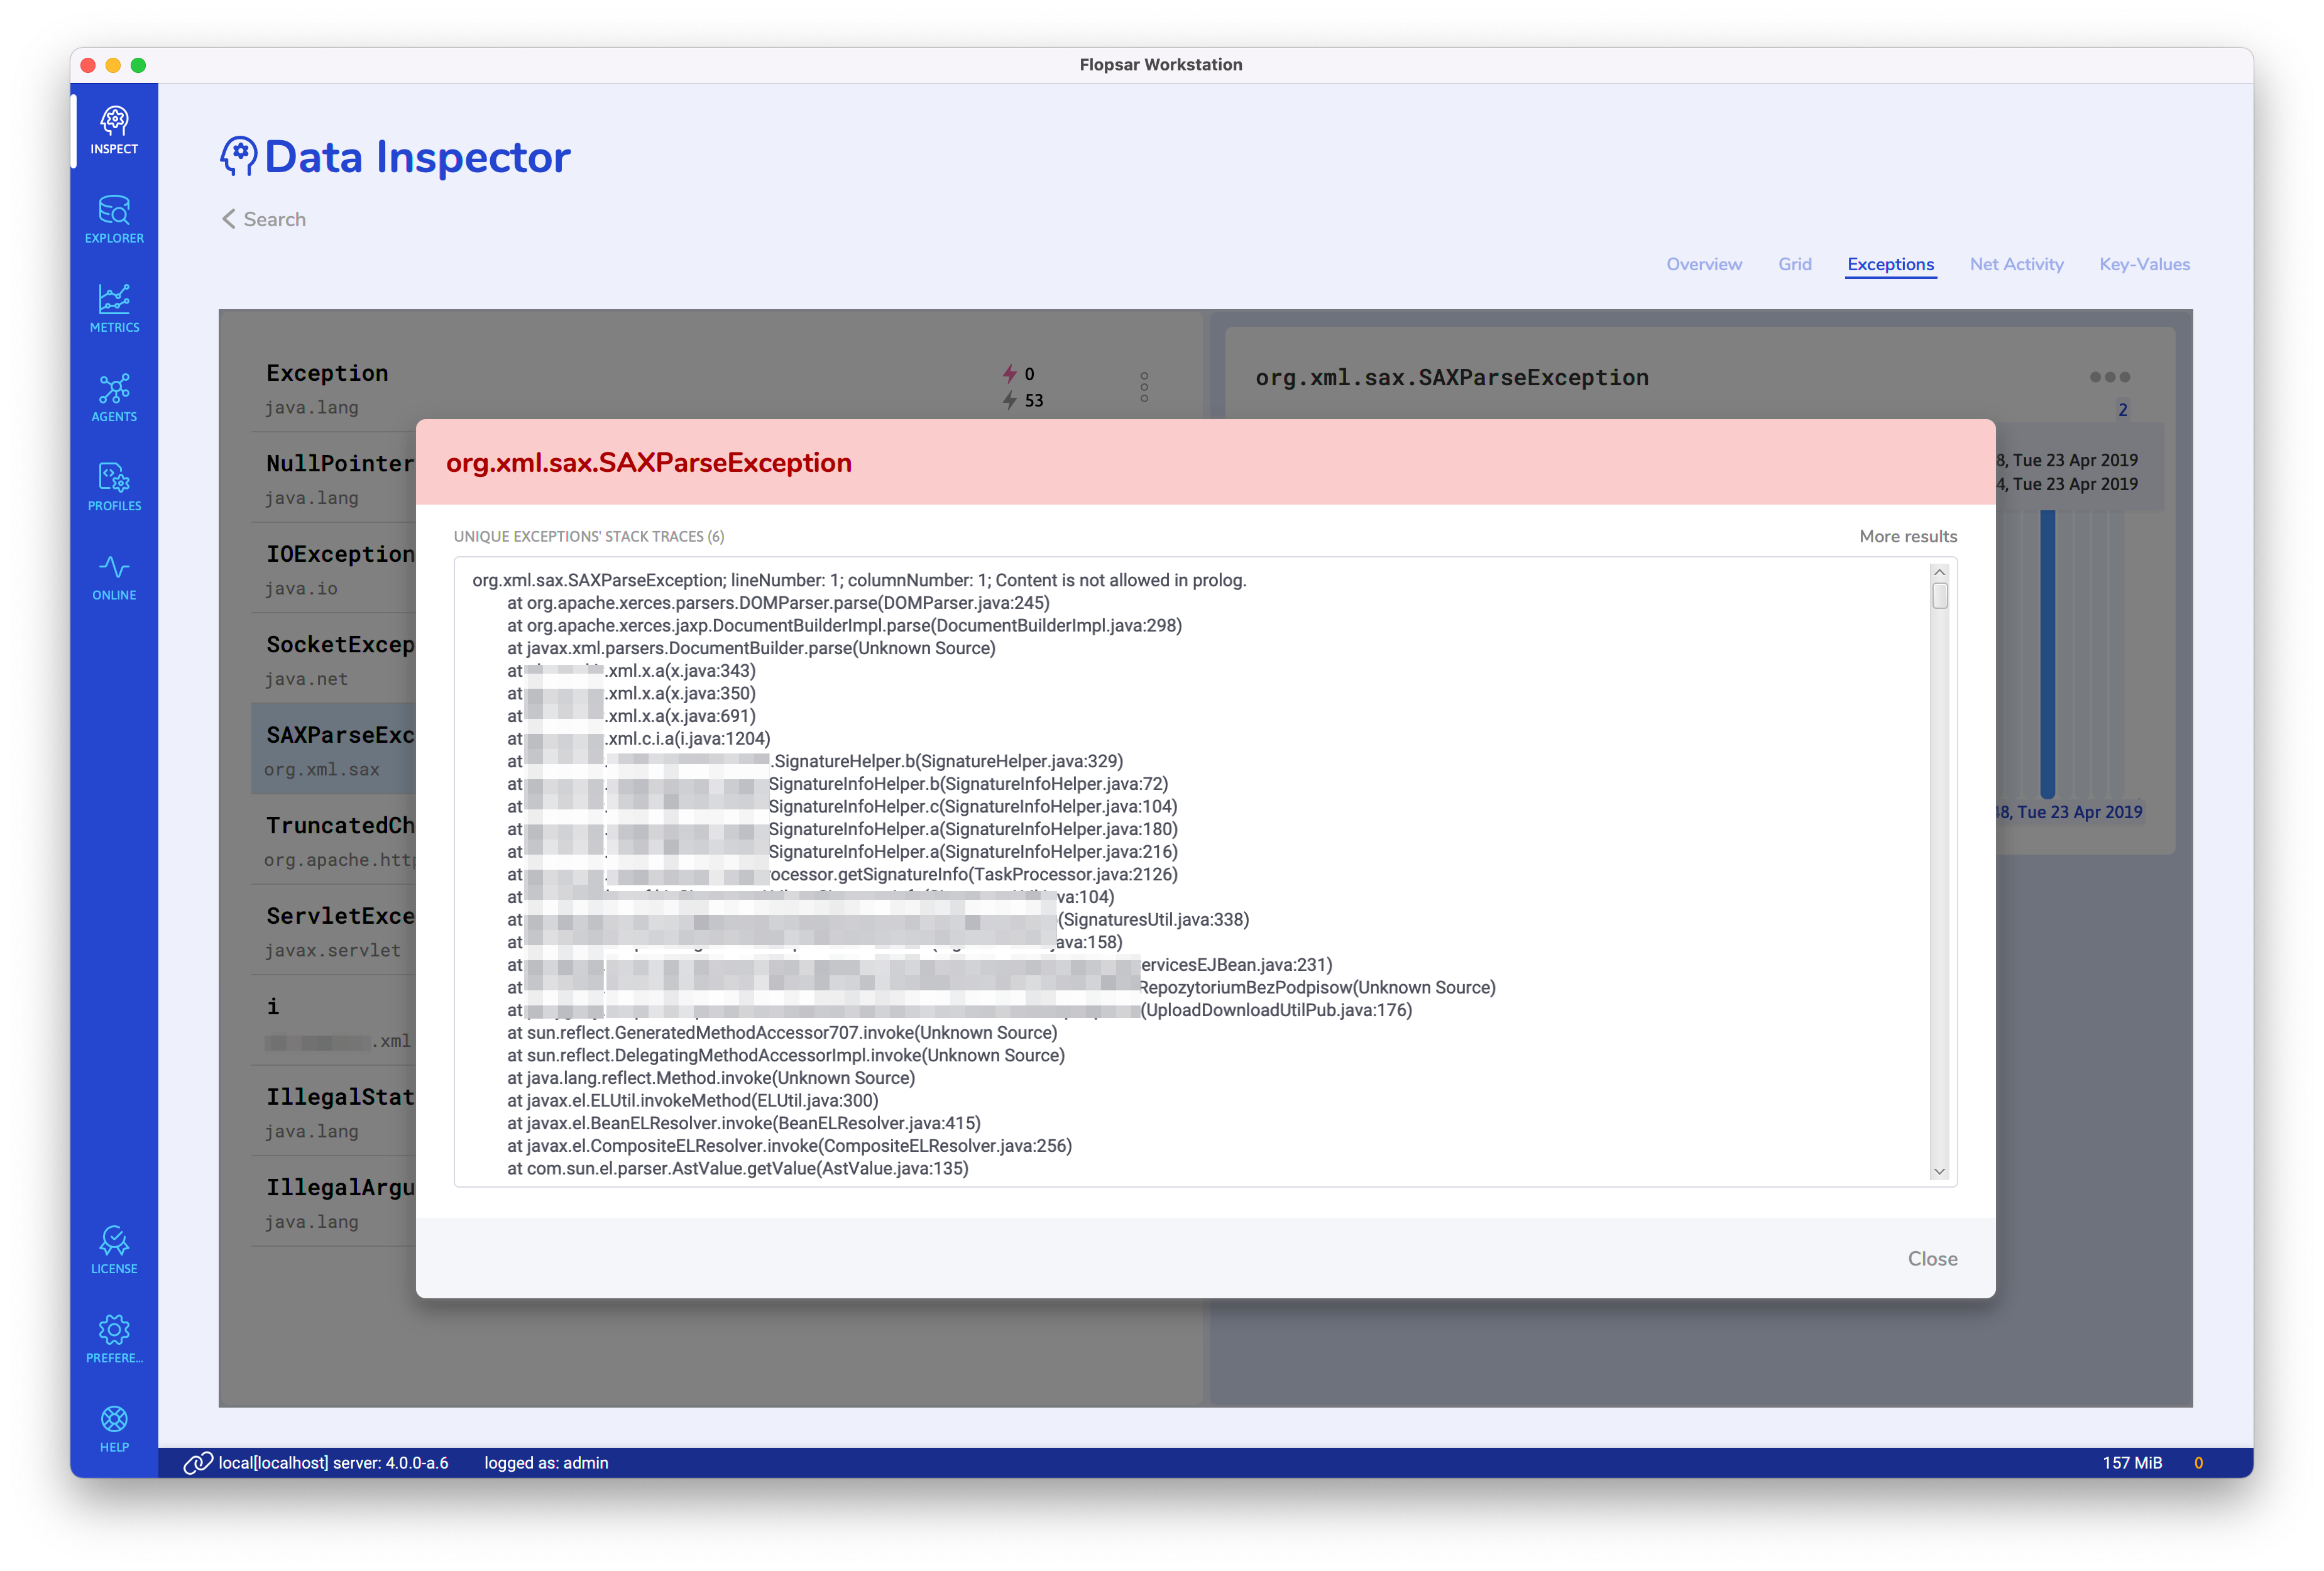
Exception Stack Traces
If you click the Exception Stack Traces menu item, you will get a list of unique stack traces of the selected exception.