Custom Key-Value Metrics
This view allows for browsing any key-value metric data collected by agents. In order to draw a graph for a selected metric, you must fill out the form below.
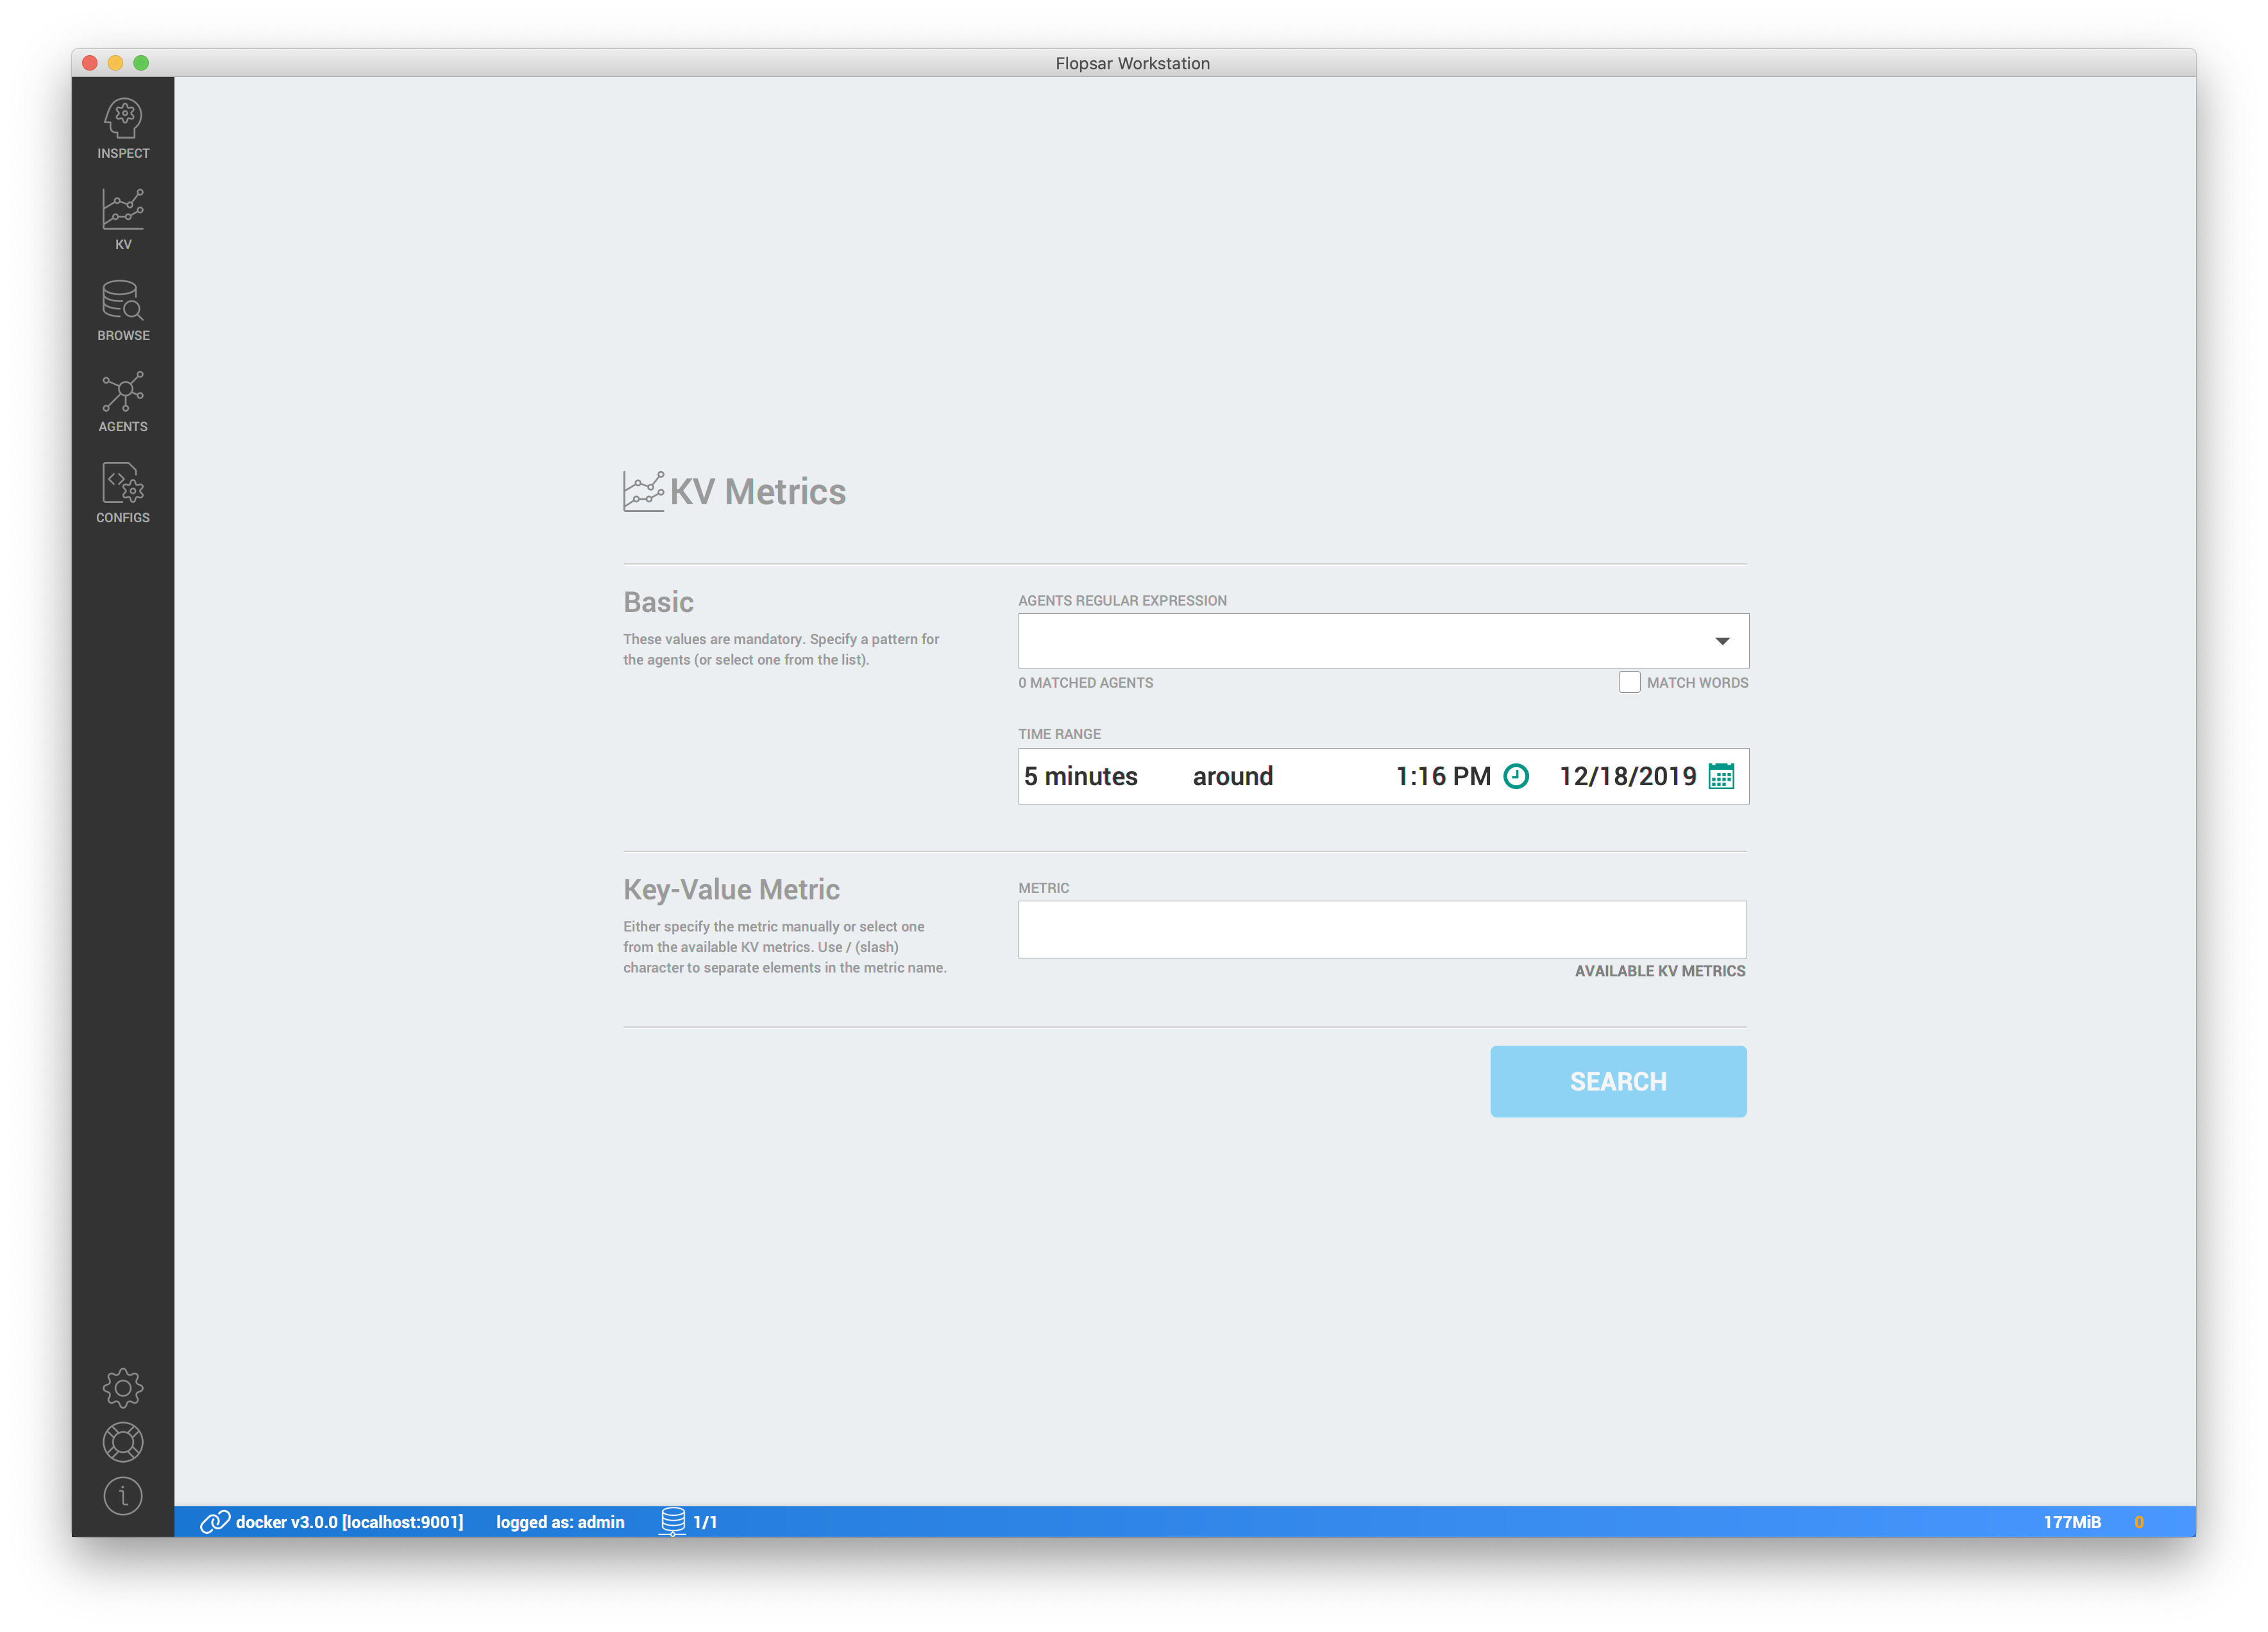
Search Form
First, you need to specify a pattern for agents, a time range, and a metric key. You can either specify the metric key manually or select one from the available metrics by clicking AVAILABLE KV METRICS link.
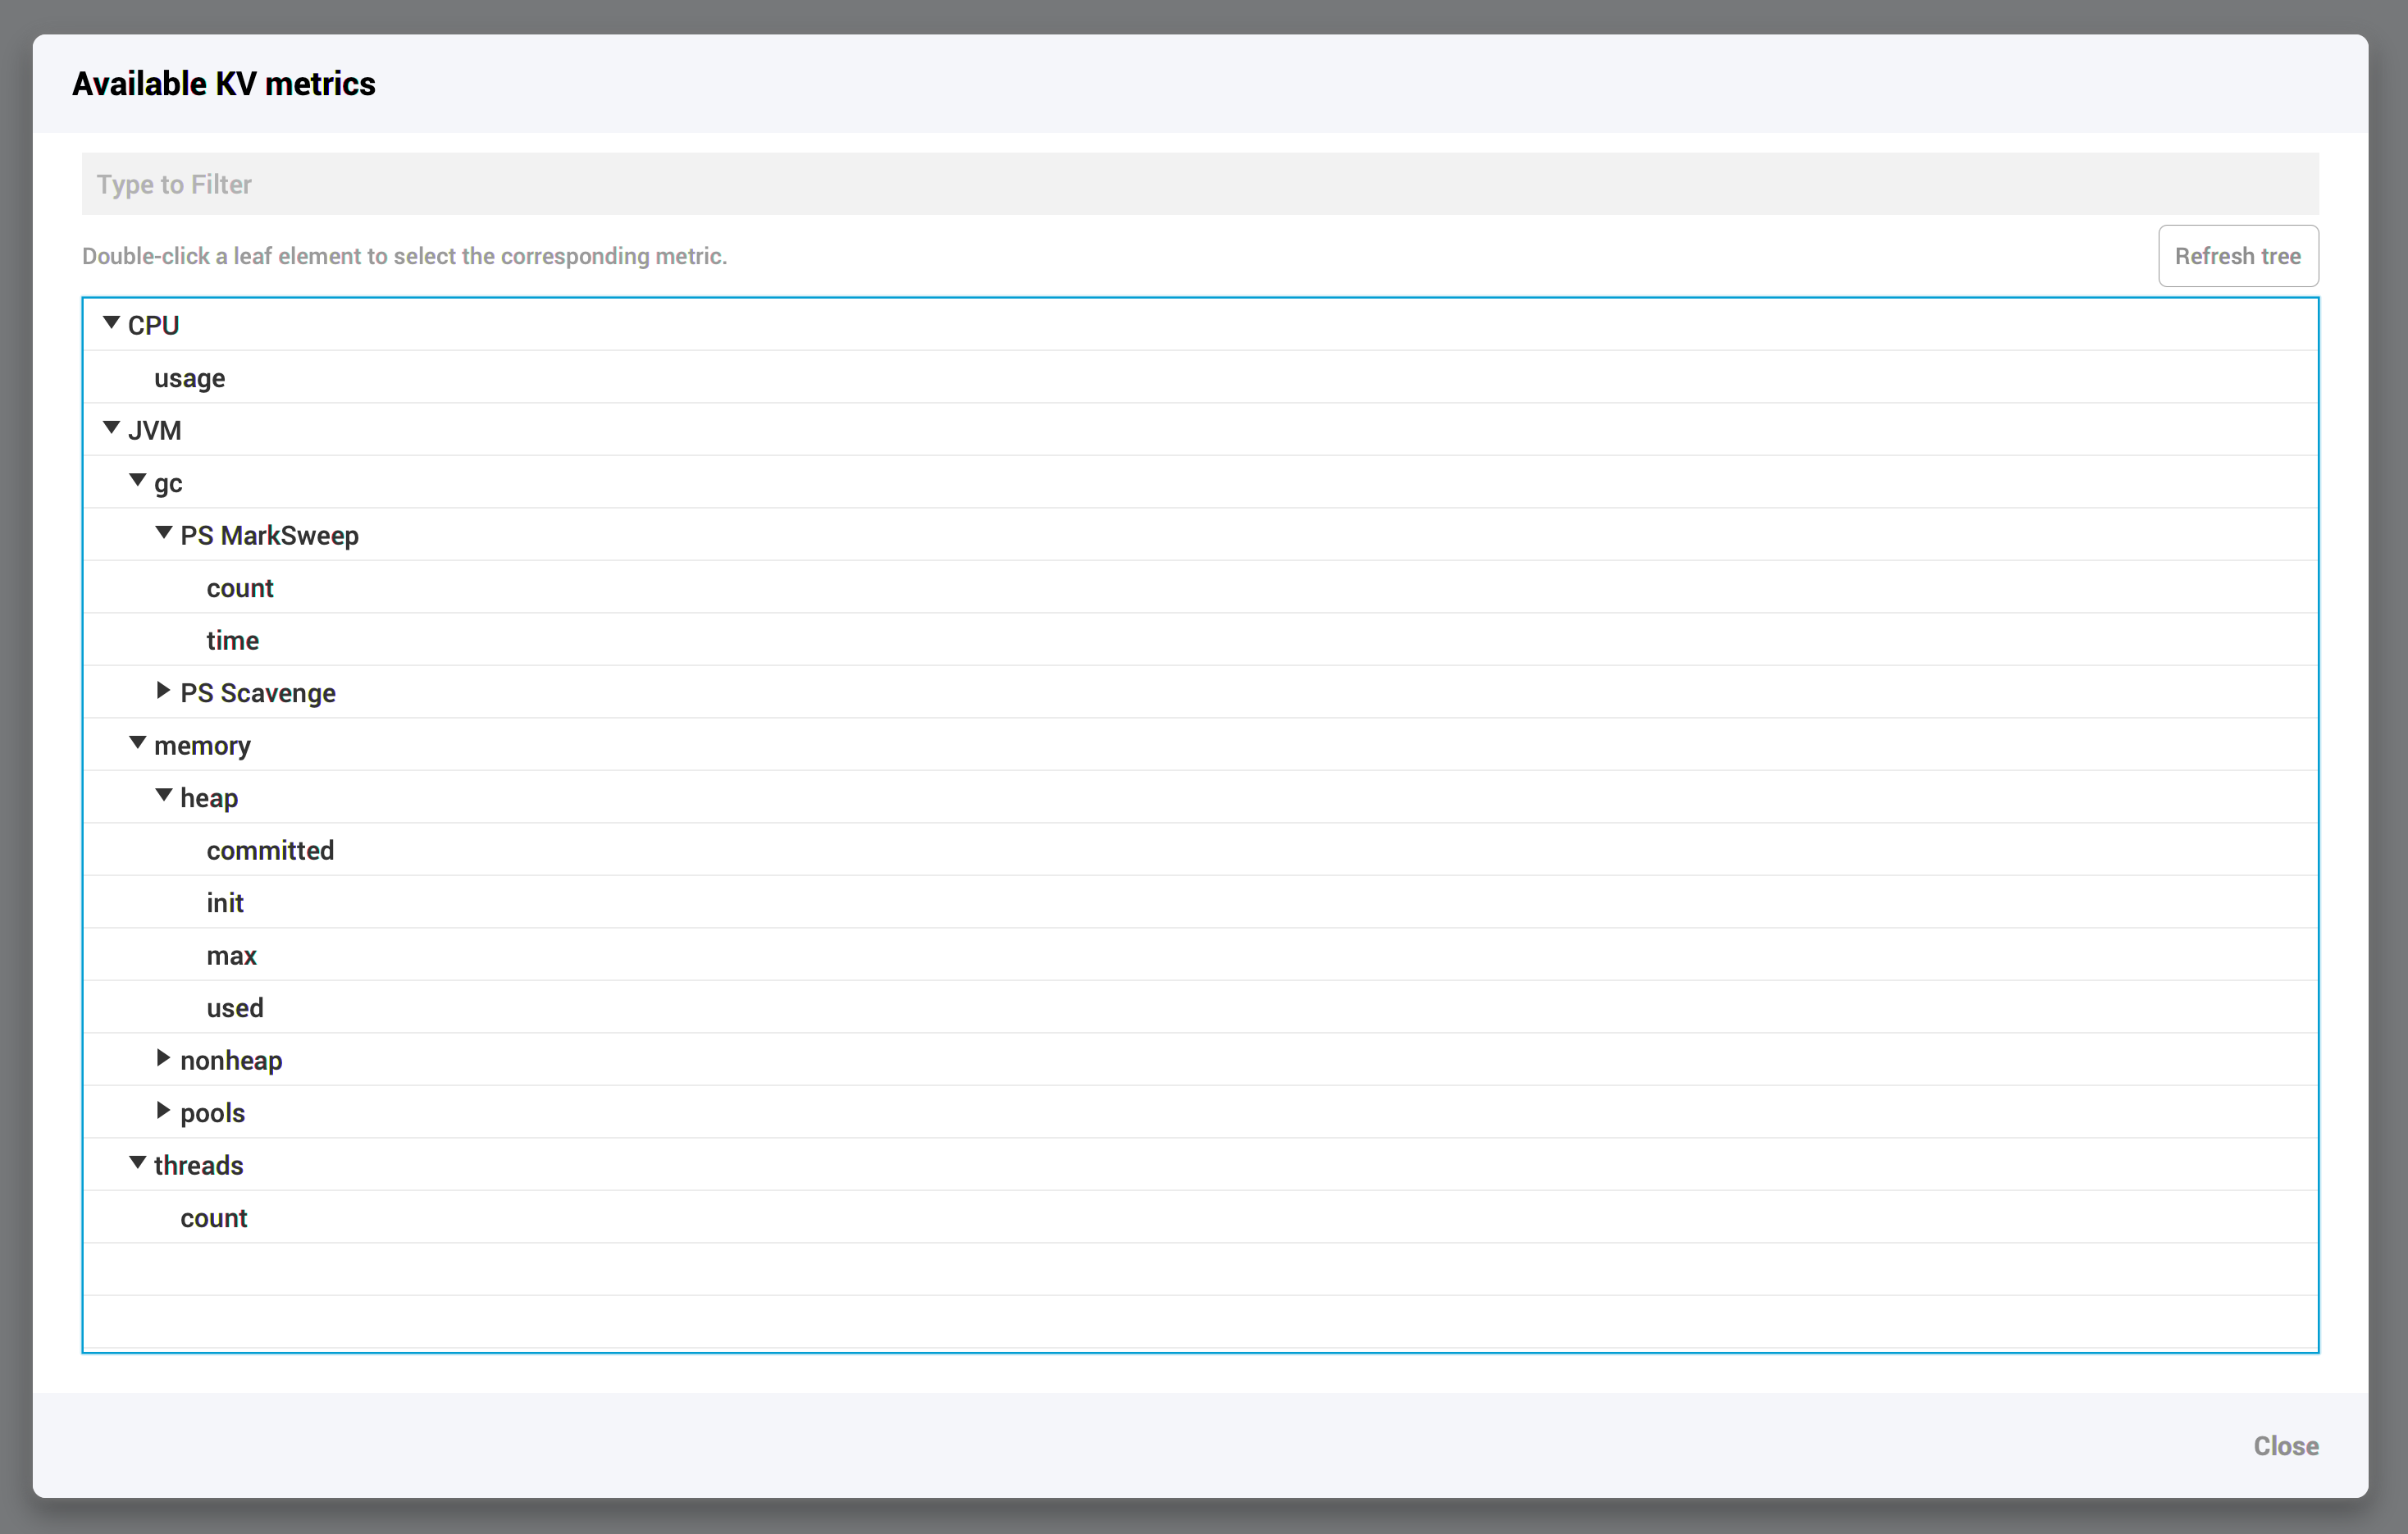
KV Metrics Tree
This popup view contains a list of all available KV metrics in a form of a tree. You can always refresh the available metrics view by clicking Refresh tree button.
KV Graph
If you click SEARCH button, a graph will be drawn for the selected metric.
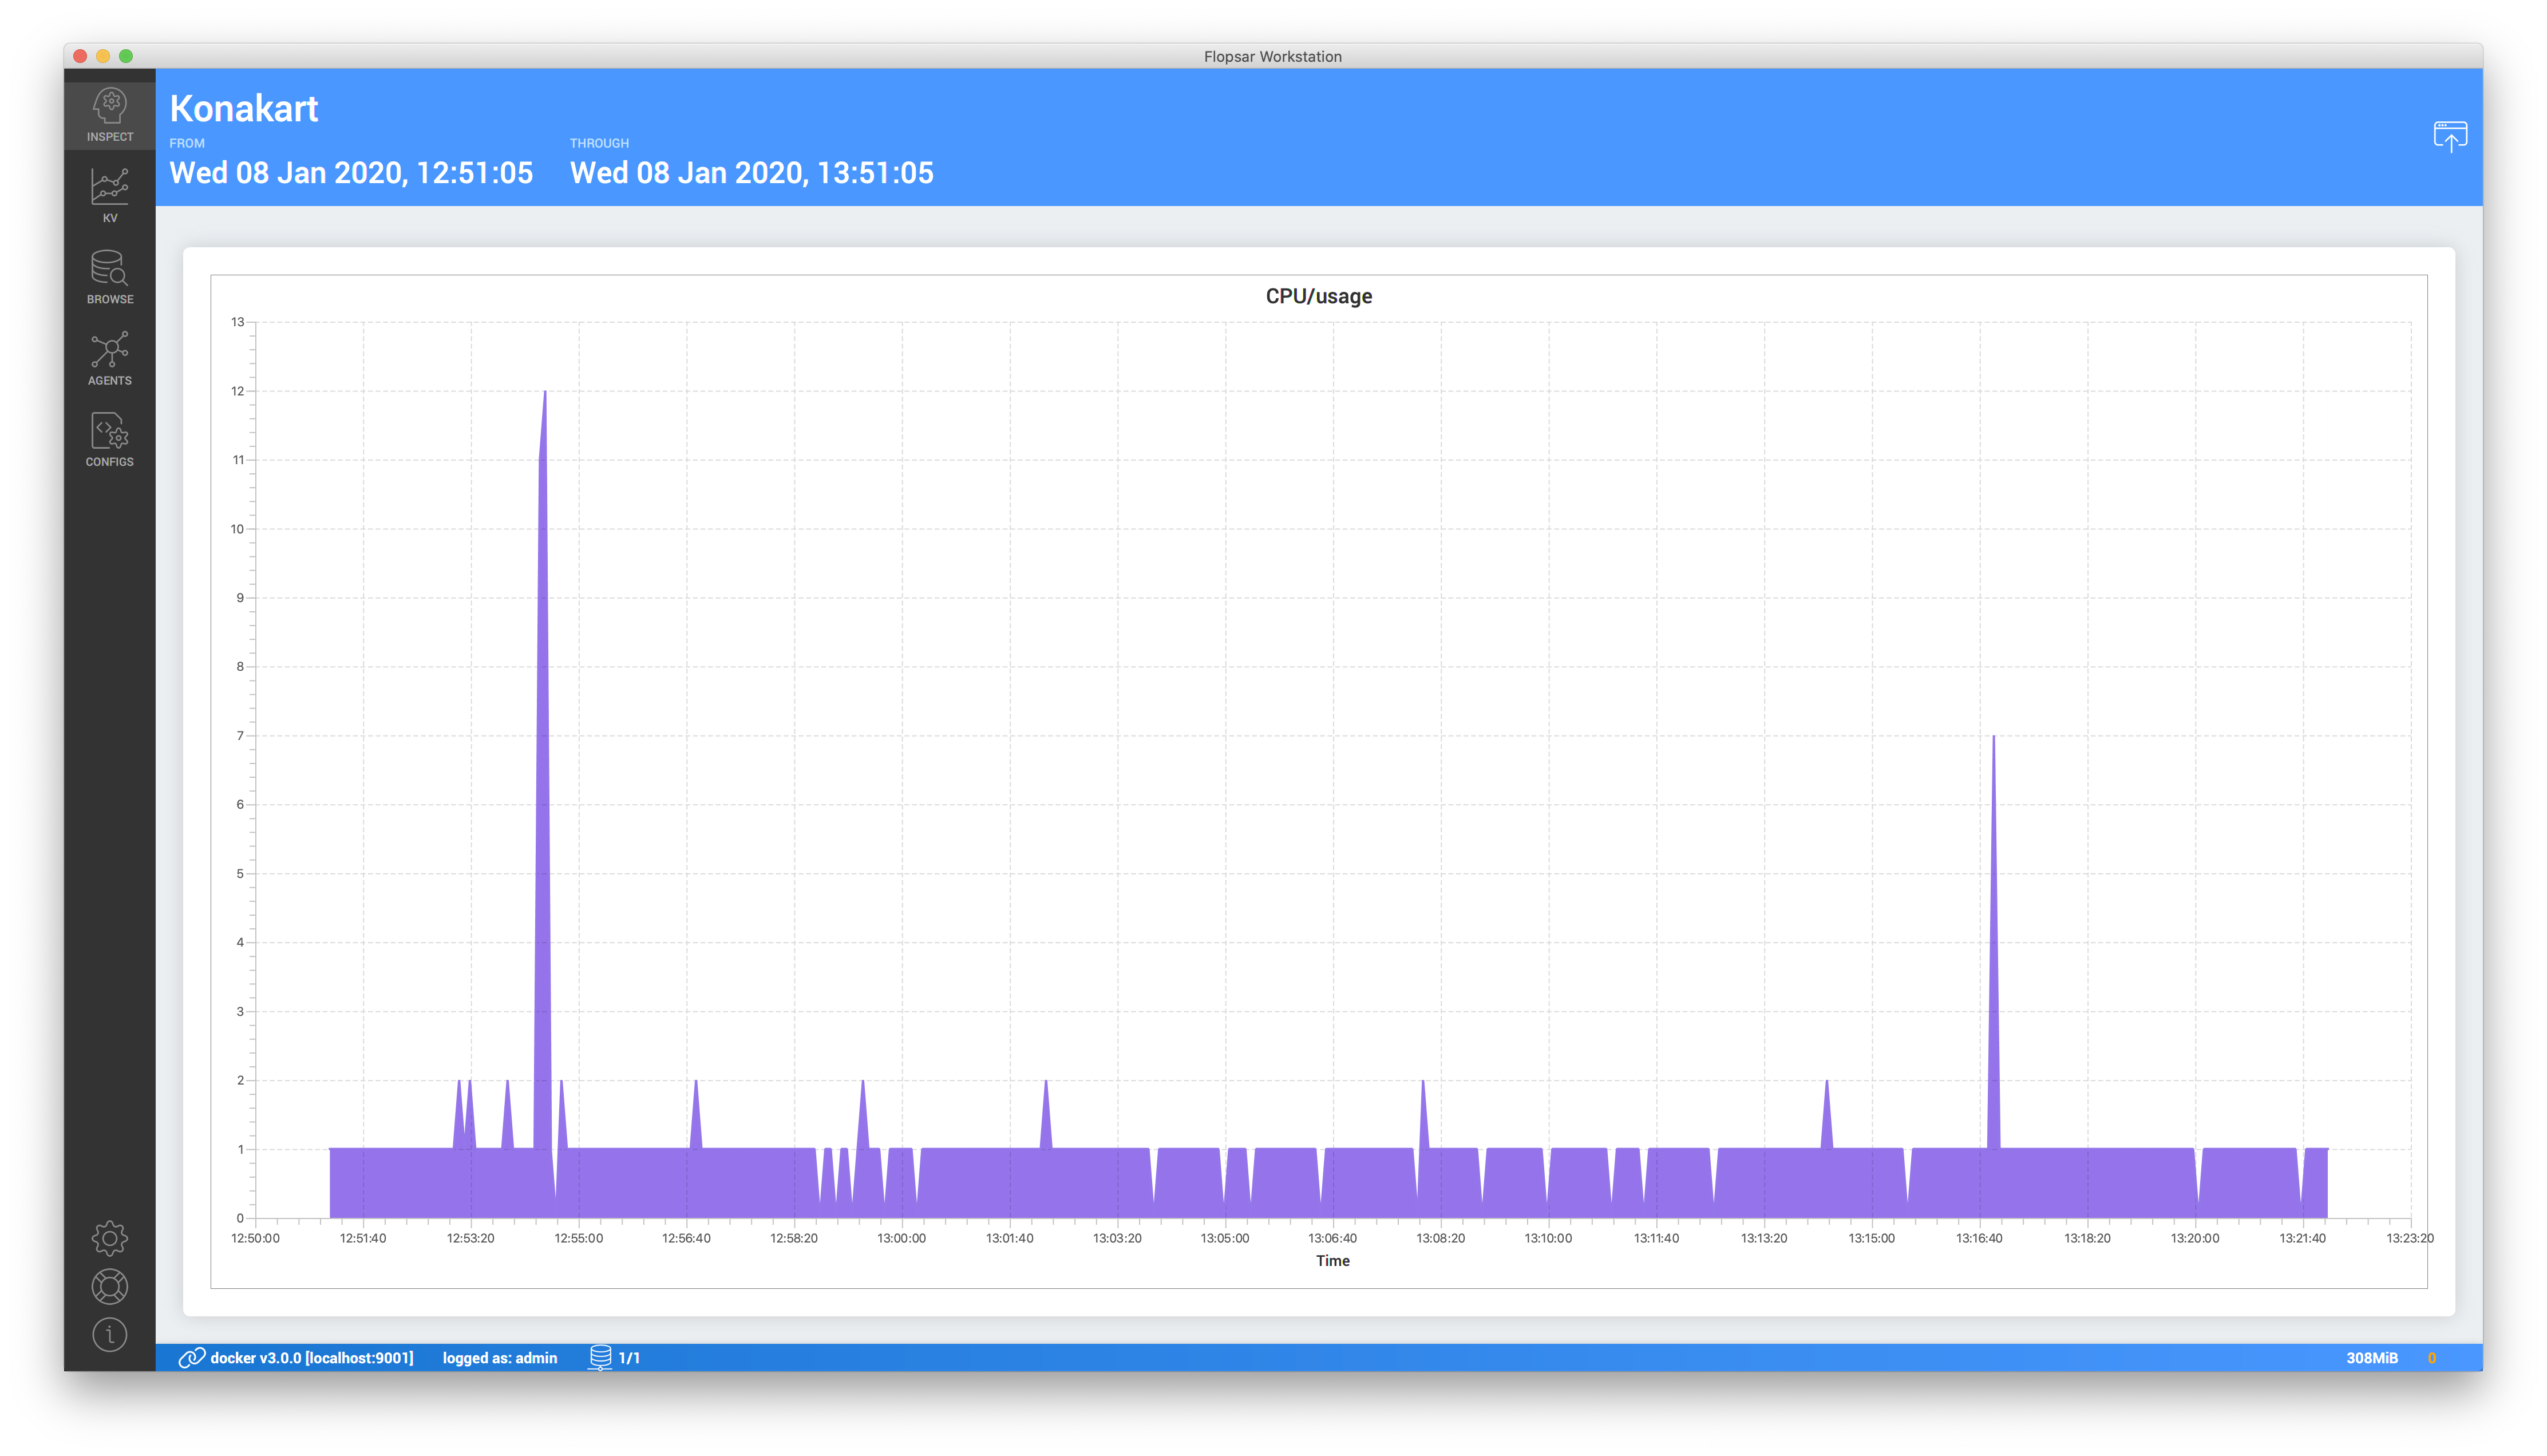
If you want to preserve the graph, you can detach the window by clicking the icon in the top-right corner of the window.
Context Menu
Each KV graph has a context menu with several actions.
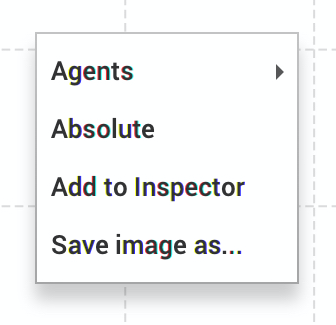
Agents
This submenu allows for selecting from which agents data should be visible.
Absolute
This option allows us to toggle between Absolute and Relative type of graph. Absolute graph means that raw data points are displayed, while Relative graph means that data points are displayed as a difference between two consecutive values. Use Relative option if, for example, your KV metric is an additive one, i.e. its value always grows and you want to observe how much it increases at each collection time.
Add to Inspector
This action adds the KV metric to the Data Inspector.
Save image as...
This action exports the graph to an image and saves it to a selected file.