Method Execution Stack
When you double click some selected record, you will get a window with the record details. The window presents a tree representing an execution stack of the selected method call. This tree view is self-explanatory but there can be situations where this view can be a bit confusing. This can happen when the displayed execution stack does not exactly correspond to the execution flow you see in your application source code. In order to understand why this situation takes place, you must understand how the execution stack tree is built.
Root Call is the very first element in the tree.
Whenever you double click on any record of the table of methods, you will get the selected method execution tree.
The detailed view of a method execution tree has three tabs:
STACK TREE: tree view,STACK SPECTRUM: list of all methods composing the tree,FLAME GRAPH: Flame Graph representation of the method execution tree.
Stack Tree
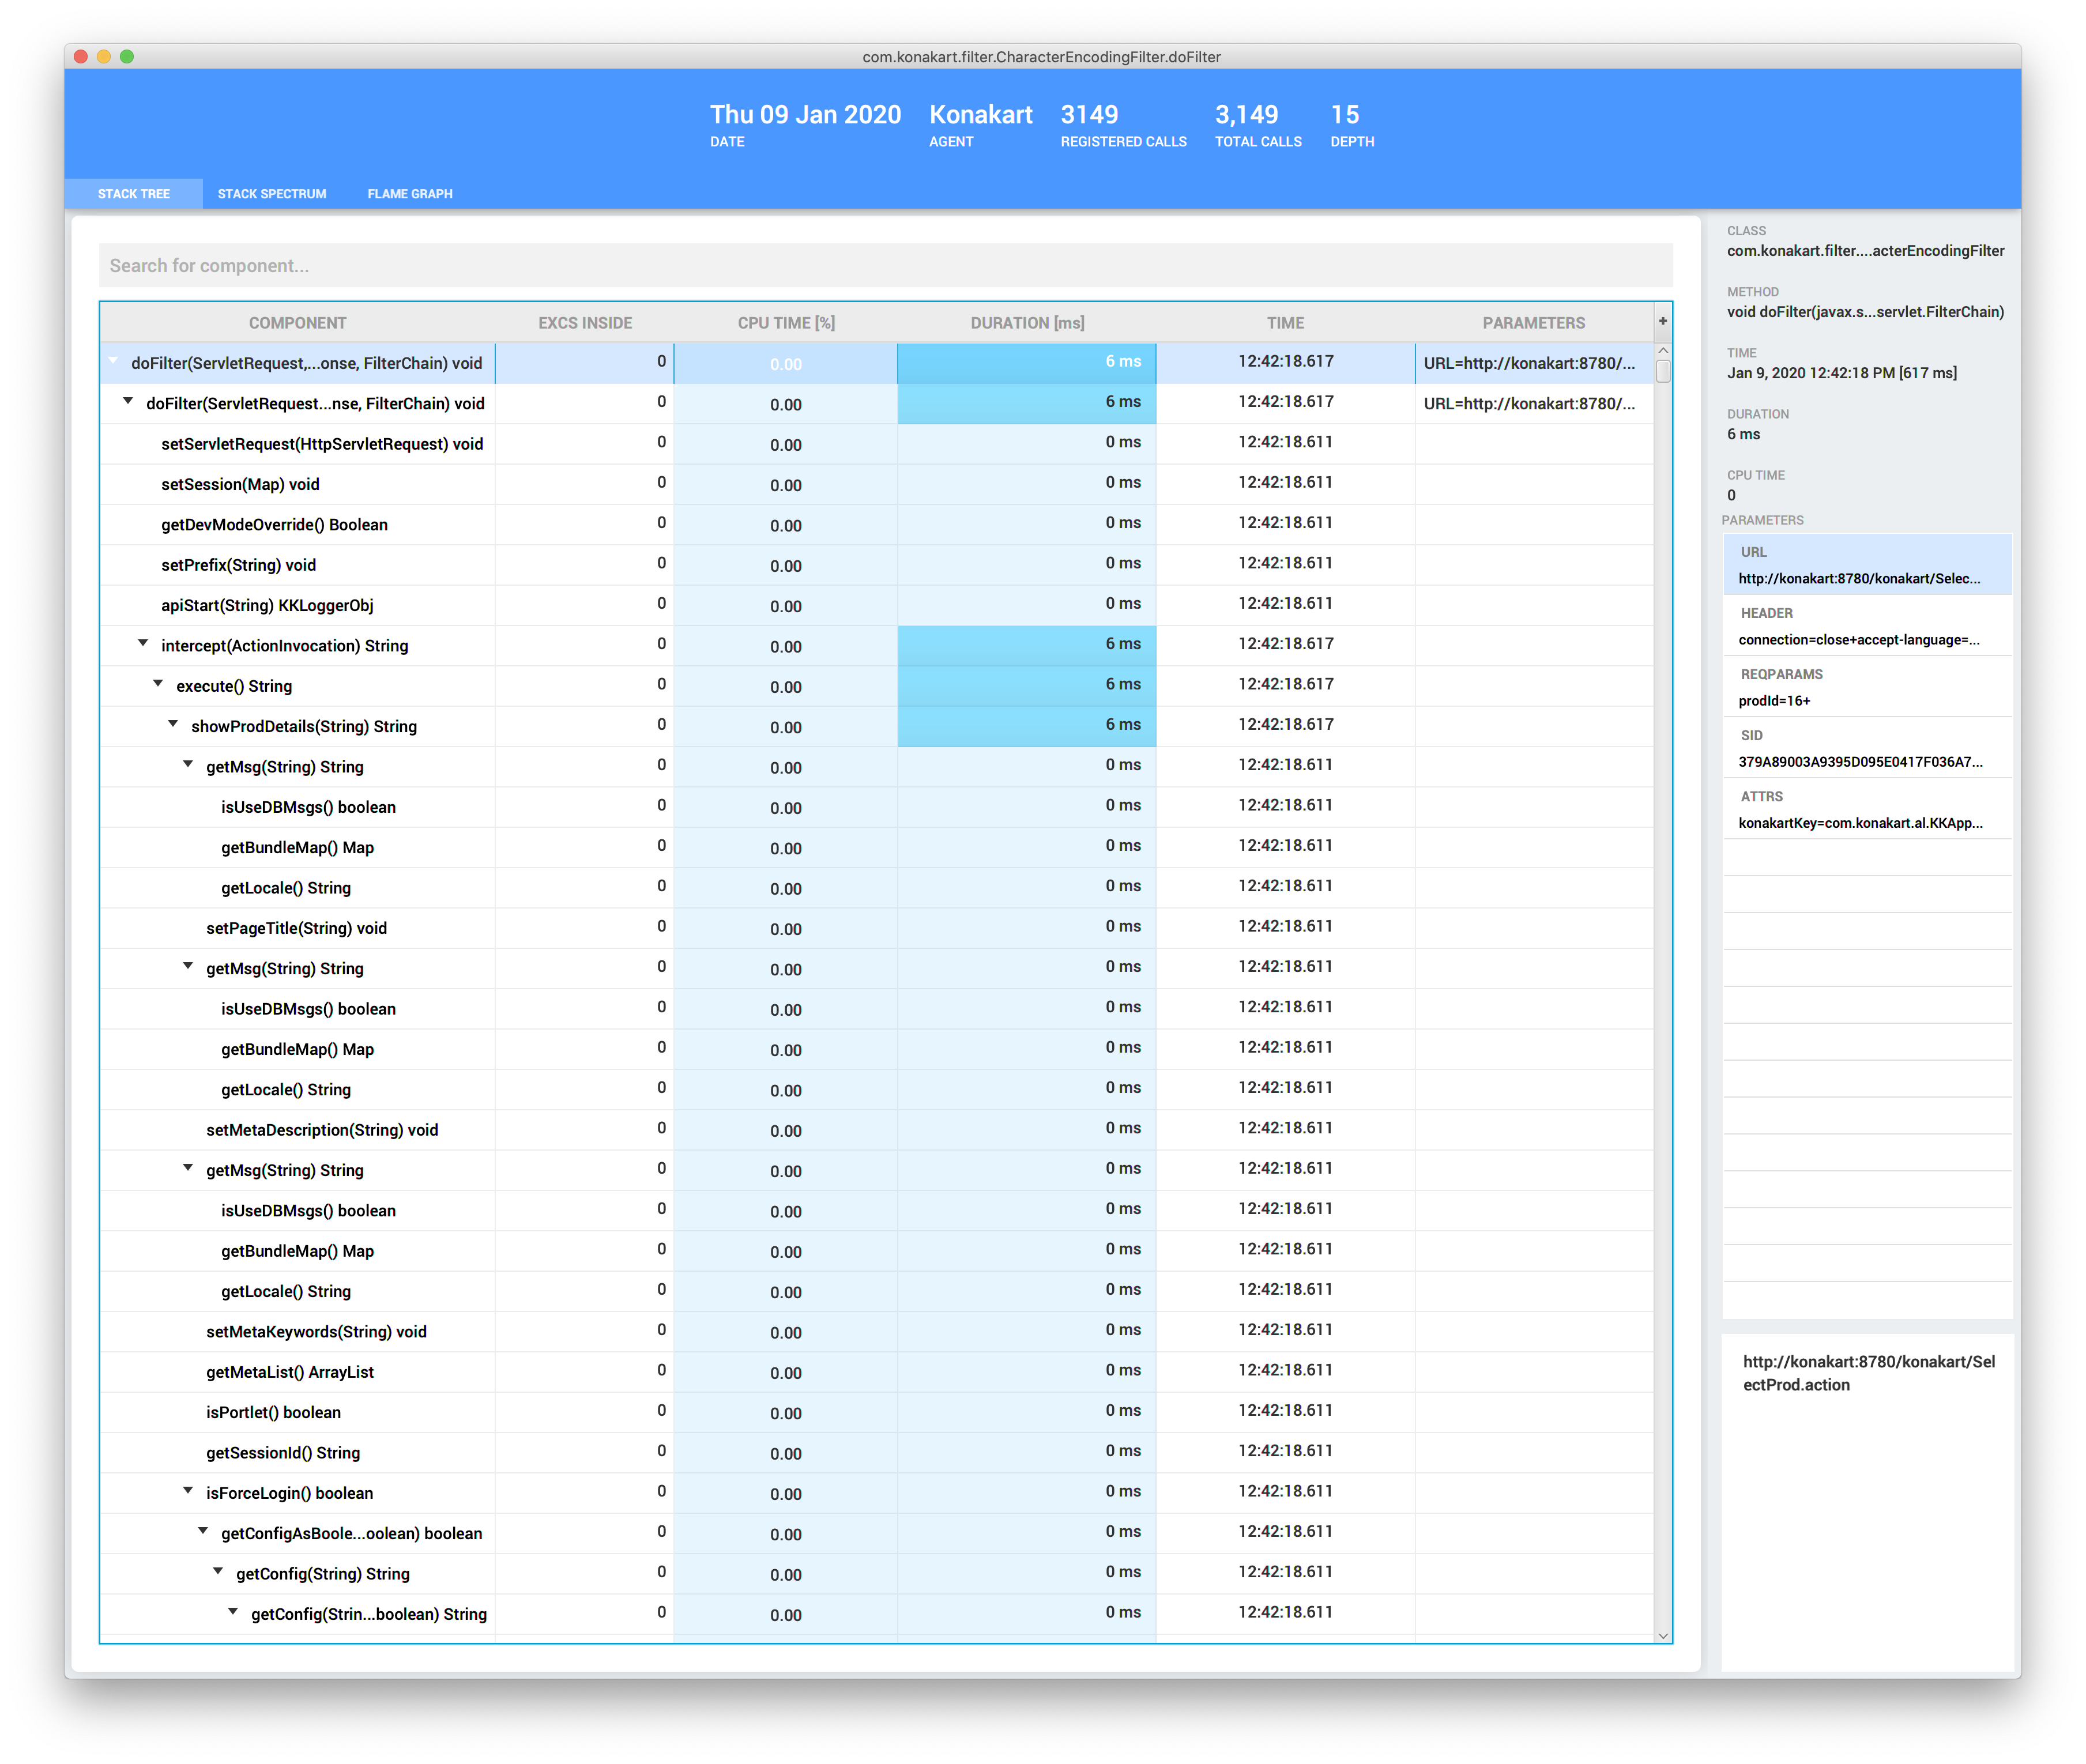
This view presents a method execution stack as an ordered tree of method calls. The tree table is composed of the following columns:
COMPONENT: method name and signature,EXCS INSIDE: number of exceptions thrown within this method execution branch,CPU TIME: percentage of duration the method spent on CPU,DURATION: method execution duration. Each cell has a colored background, which represents the duration share with respect to the root element duration value,TIME: time stamp of the end of the method execution,PARAMETERS: method parameters preview.
Whenever you click a record in the table, the details of the selected method are displayed on the right panel. The details cover:
CLASS: fully qualified class name the selected method is member of,METHOD: method name and signature,TIME: time stamp of the end of the method execution,DURATION: method execution duration,CPU TIME: time the method spent on CPU,
Additionally, when the selected method has parameters, they are displayed in the PARAMETERS list.
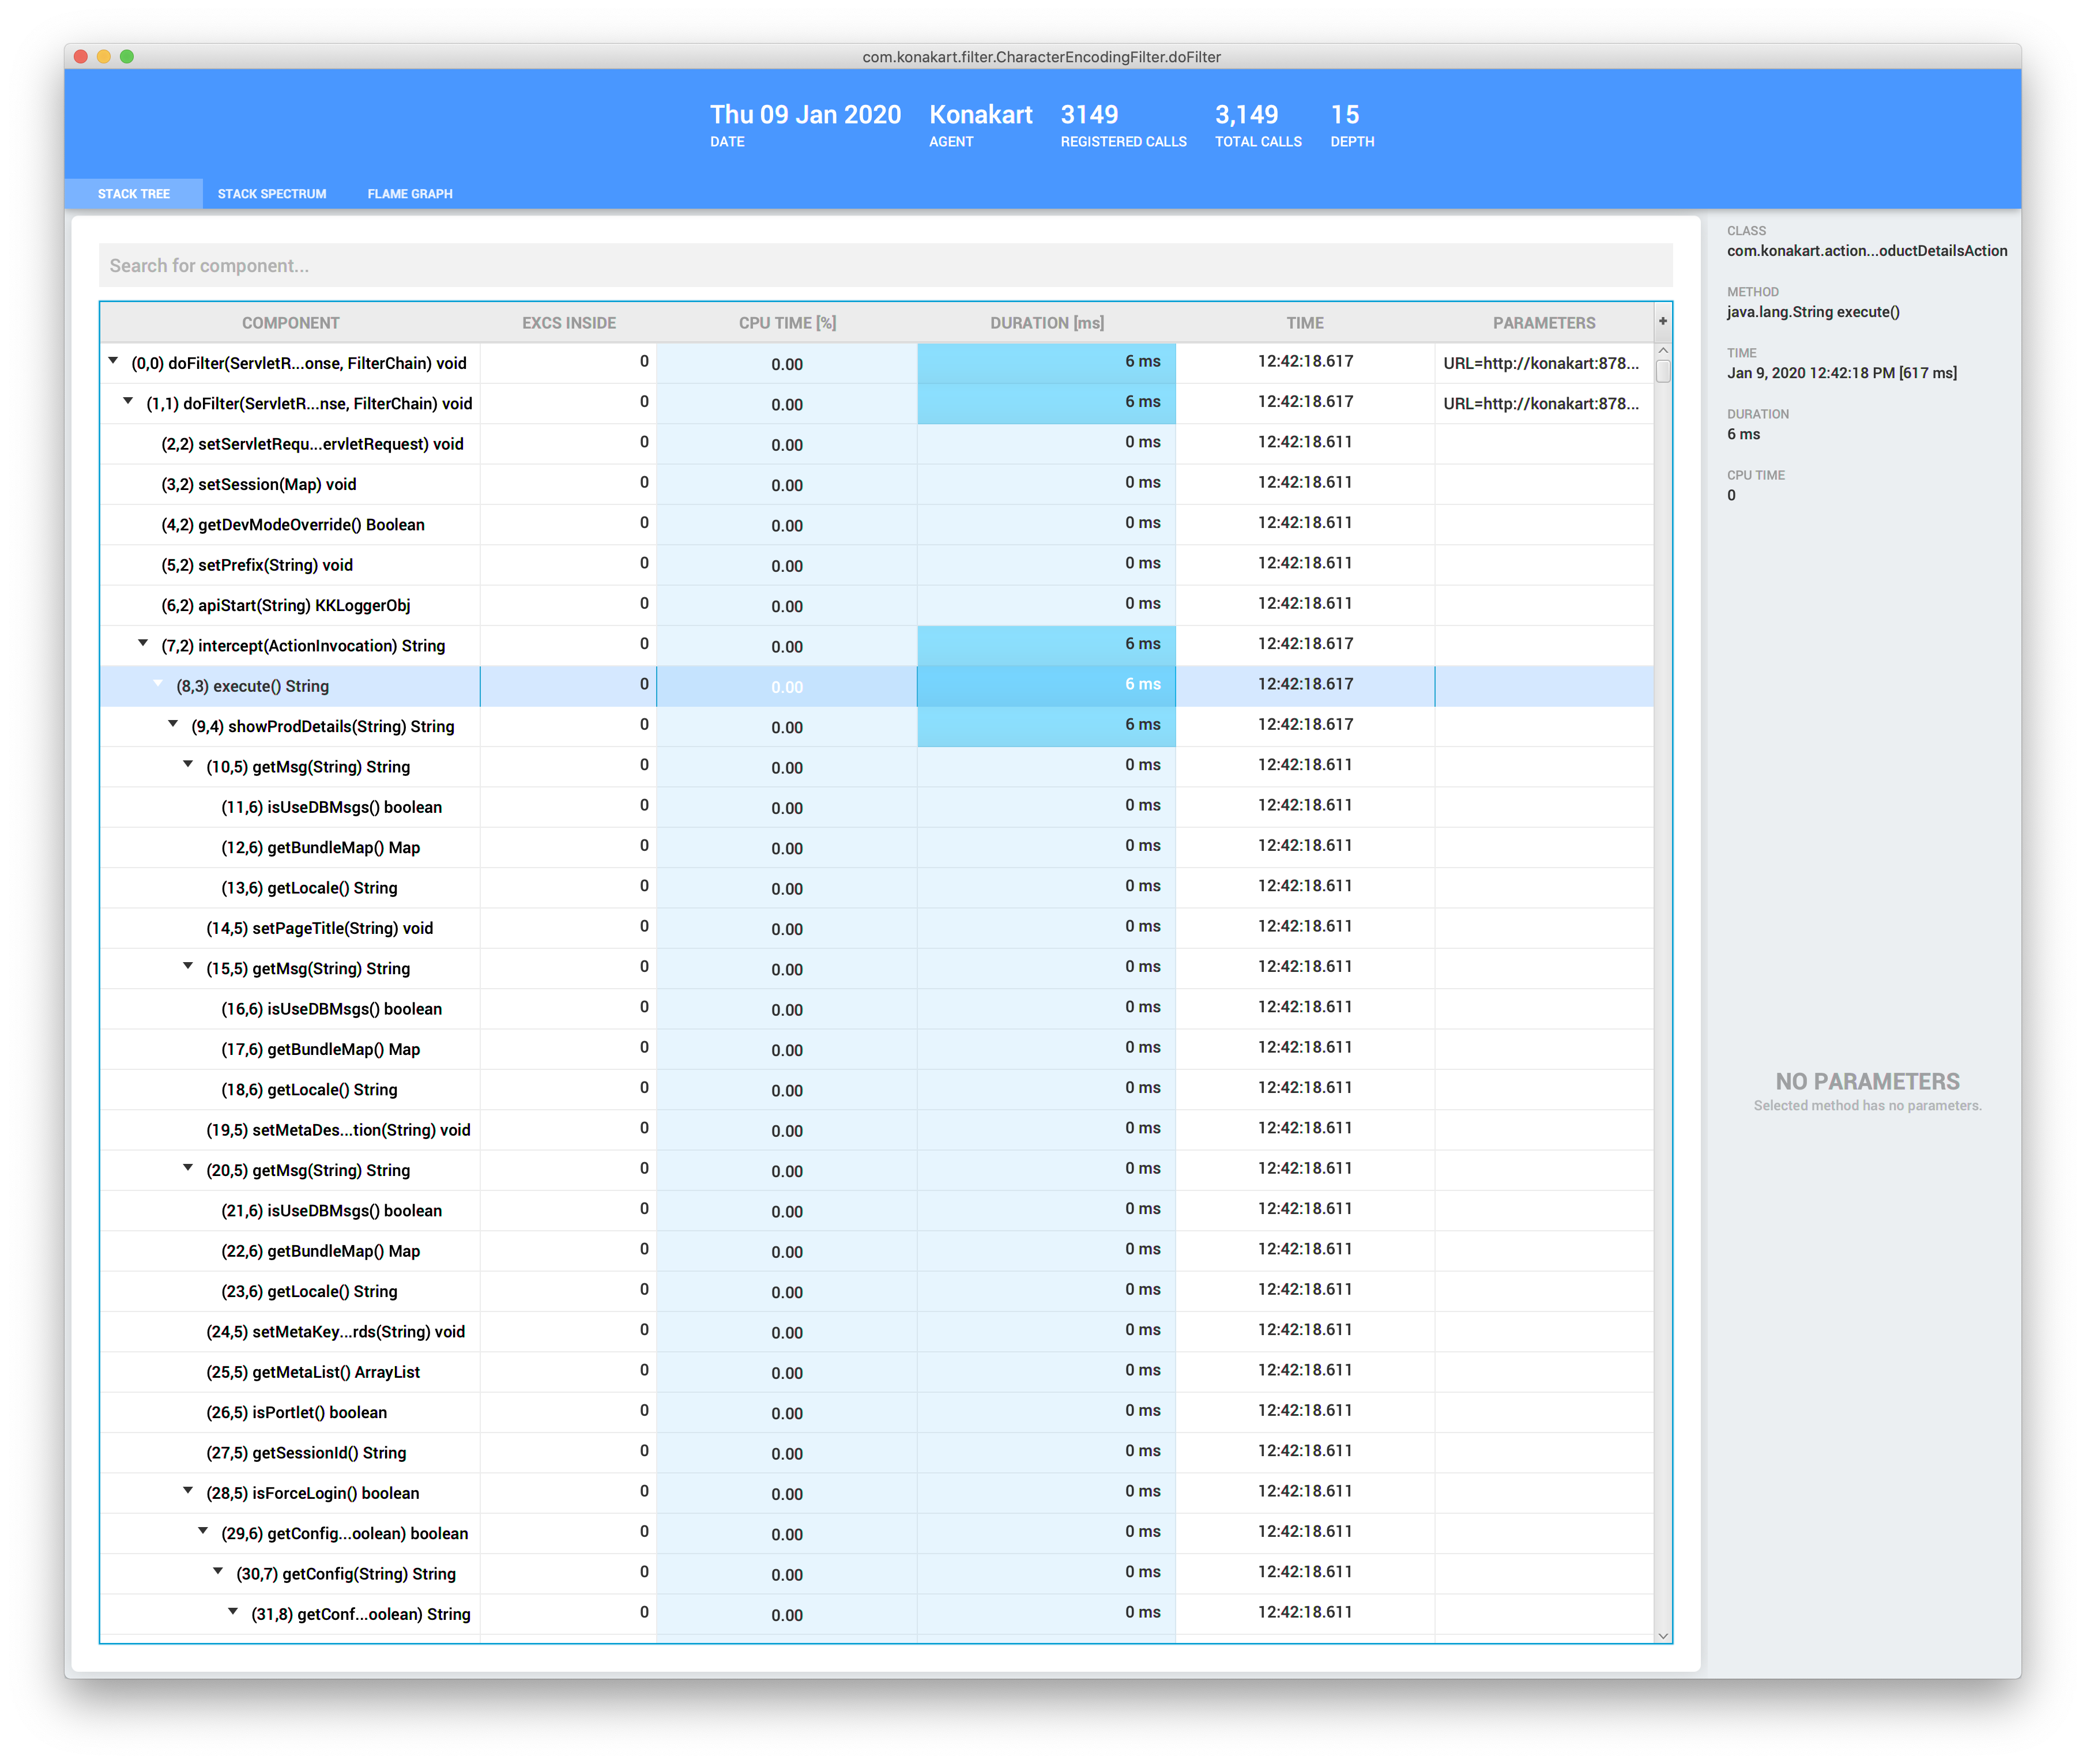
If you want to know the exact location of a method call within the execution stack, you can select the Elements Position from the context menu on the tree view. Next time, you expand a branch on the execution stack you should see the positions of methods. The position is determined by two numbers, the first one denotes the sequence number within the stack and the second one denotes the stack depth.
Context Menu
There are several actions you can perform on the stack tree view. The actions are available from the context menu.
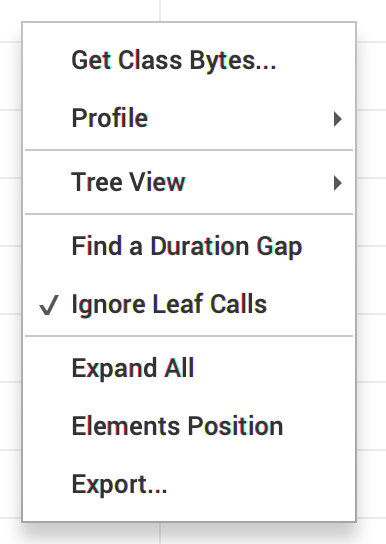
Get Class Bytes...
This action allows for downloading a class file of the selected method so that you can decompile it in any decompiler of your choice.
The agent, where the class comes from, must be connected to your Server in order to download the class.
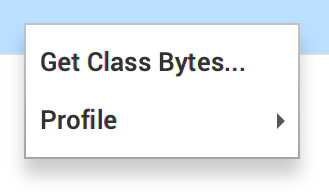
Profile
This submenu allows to quickly add a new rule to the same profile, the corresponding agent is attached to. The submenu contains the following actions:
Add with Formatter...: creates a new rule with a formatter. The create rule form is prefilled with the method and class data,Exclude Class: creates a new exclusion rule, which makes the class excluded from instrumentation,Exclude Method: creates a new exclusion rule, which makes the method excluded from instrumentation.
Tree View
This submenu allows you to filter out methods from the tree. The submenu contains the following options:
Complete: no method is filtered out (default). A complete tree is presented,Critical: filters out all methods but the one with the biggest duration value at any branch,Exceptions: filters out methods, which do not have exceptions thrown within their branches.
Find a Duration Gap
Finds a method in the tree, which has the largest value gap between its duration and all of its methods it invokes directly. If Ignore Leaf Calls option is selected, this action ignores methods, which do not invoke any other methods.
Expand All
This action expands the entire tree.
Elements Position
This action makes the method elements position data visible.
Export...
Exports the entire tree to XML and saves it to a selected file.
Stack Spectrum
When you select the STACK SPECTRUM tab, you will get a spectrum view. This view presents a spectrum of the execution stack, in other words, it shows a collection of all the components which constitute the stack along with their calls and exceptions statistics.
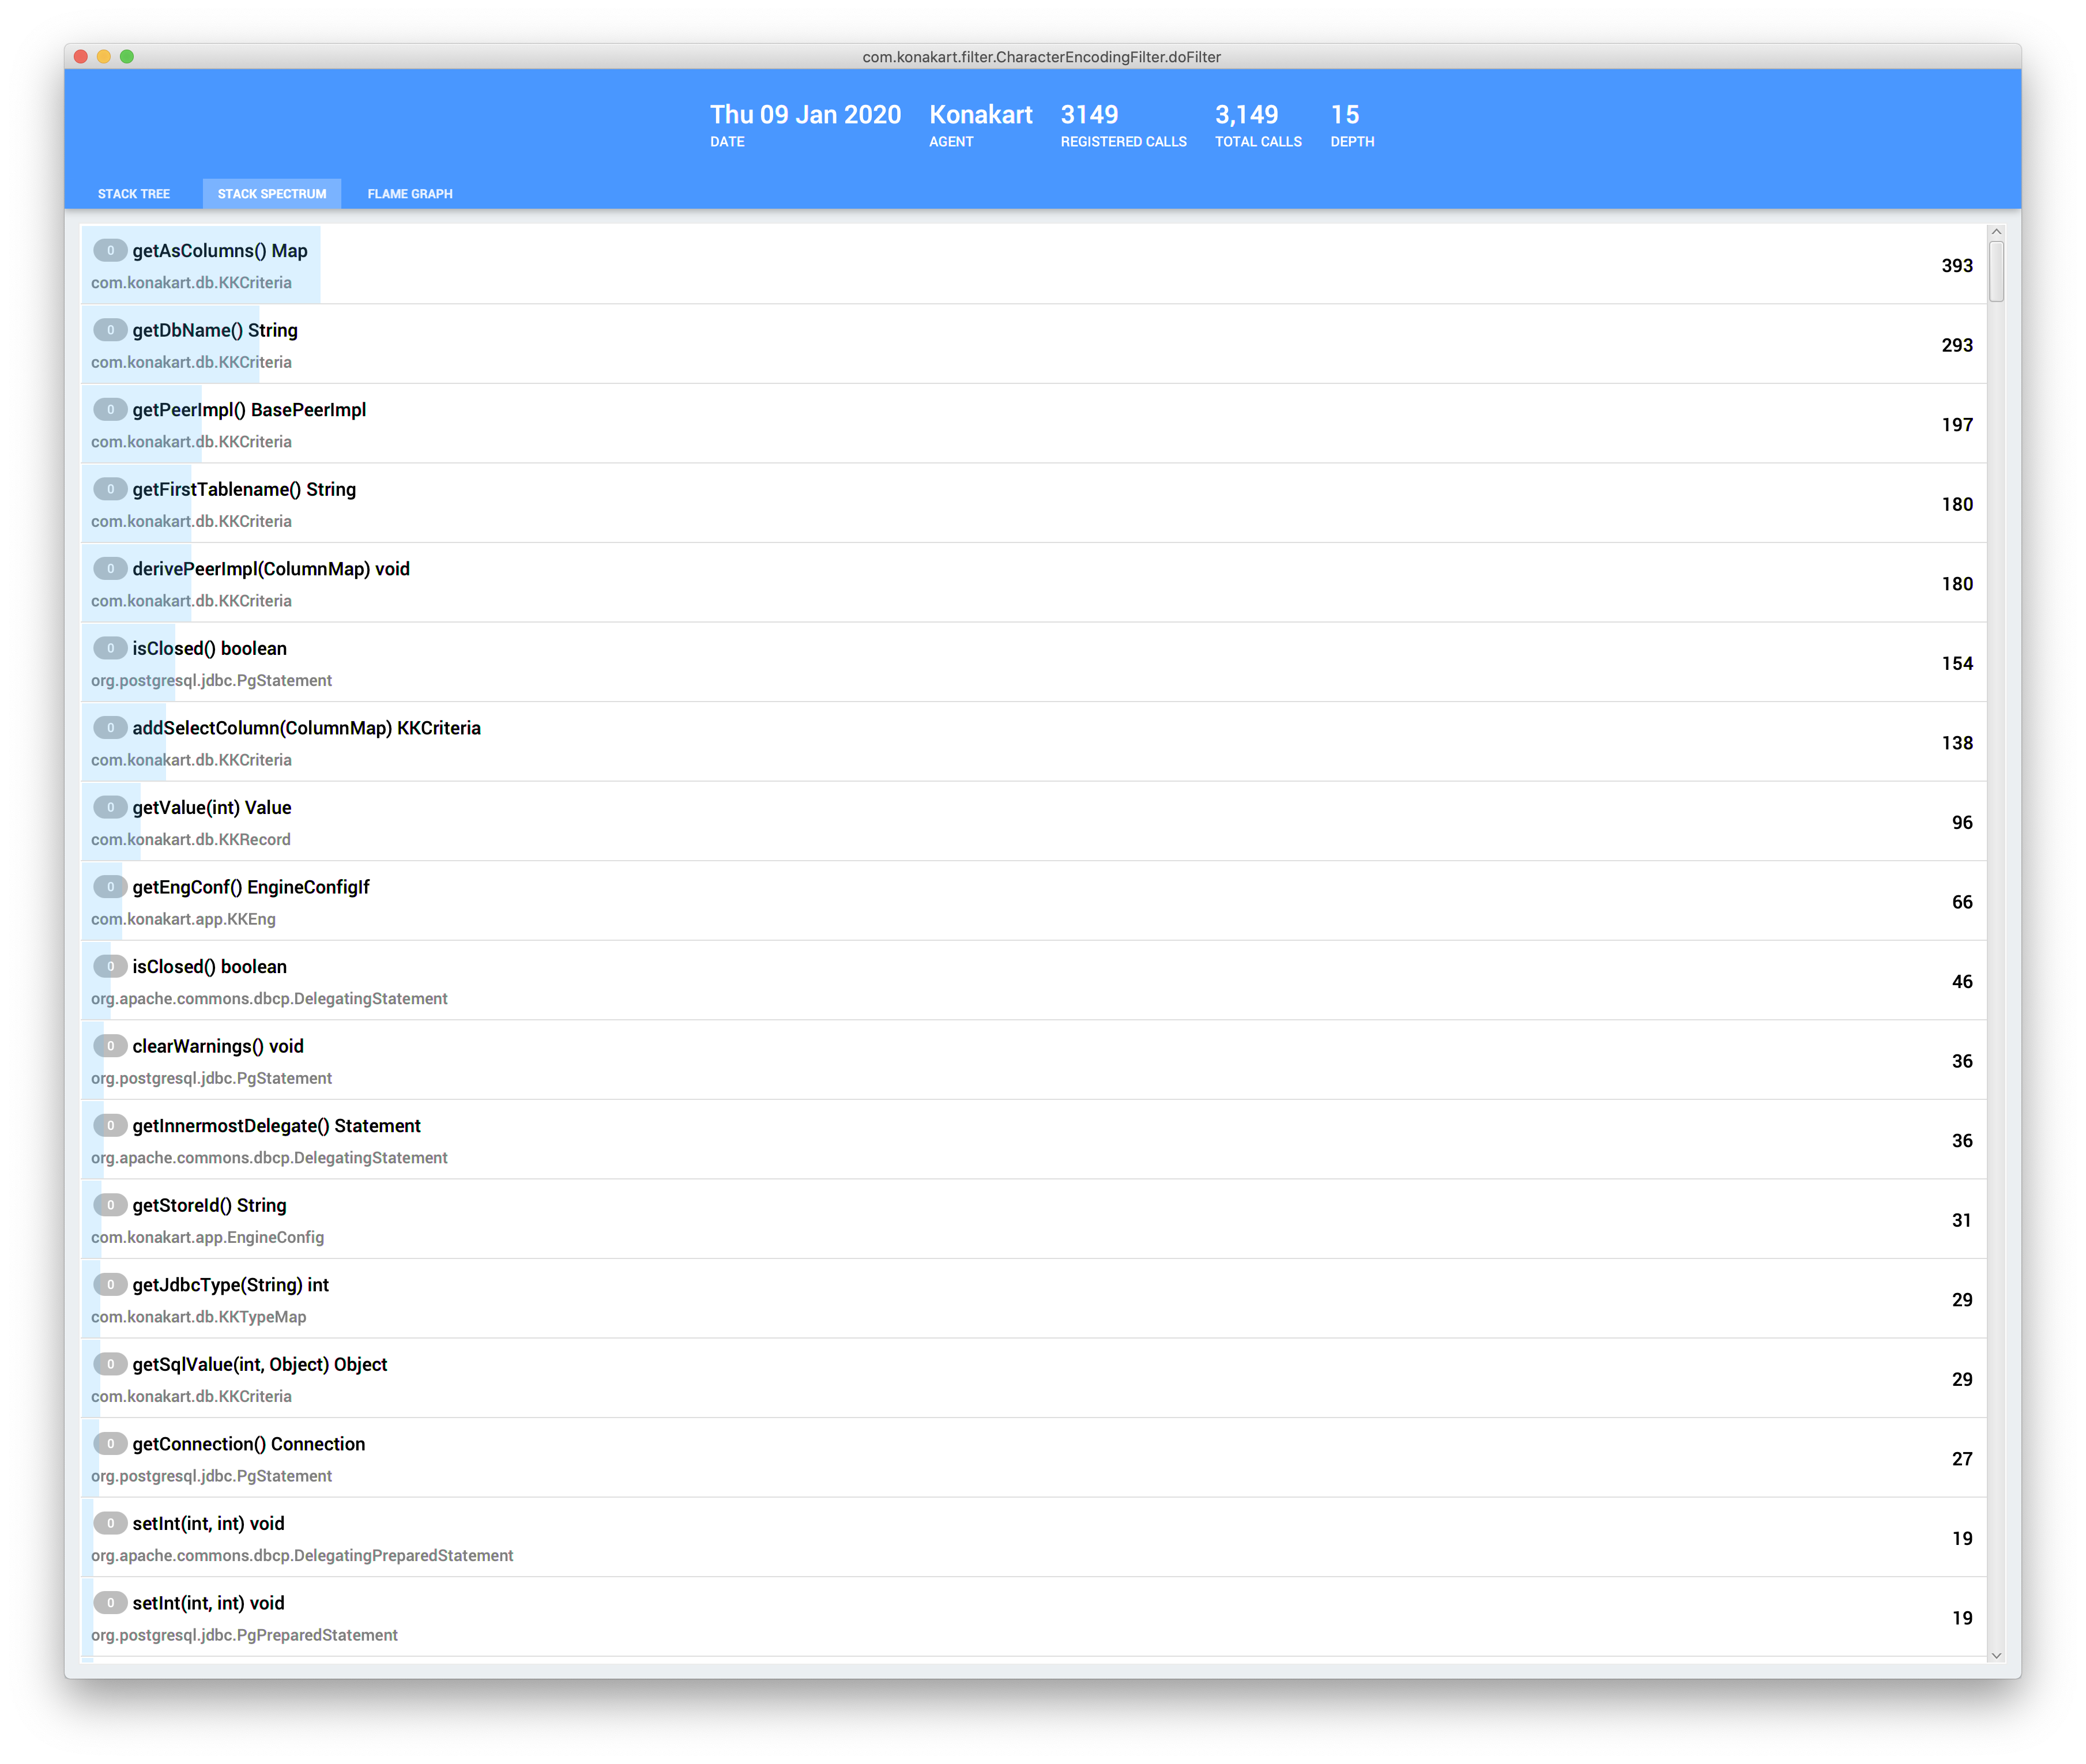
Spectrum Element
Each record in the spectrum represents a unique method, i.e. the record identifies a method by its origin class and signature. If there are multiple calls of the same method in the tree, the number of times it is executed is presented on the right of the record entry. Each record has a colored background, which represents a ratio of a number of the corresponding method executions to the total number of all calls. Each record has also a banner with a number inside. This banner presents how many exceptions is thrown by the corresponding method. If you click on the record with a number in the banner, a popup window will appear with a list of all the exceptions thrown in the represented method.
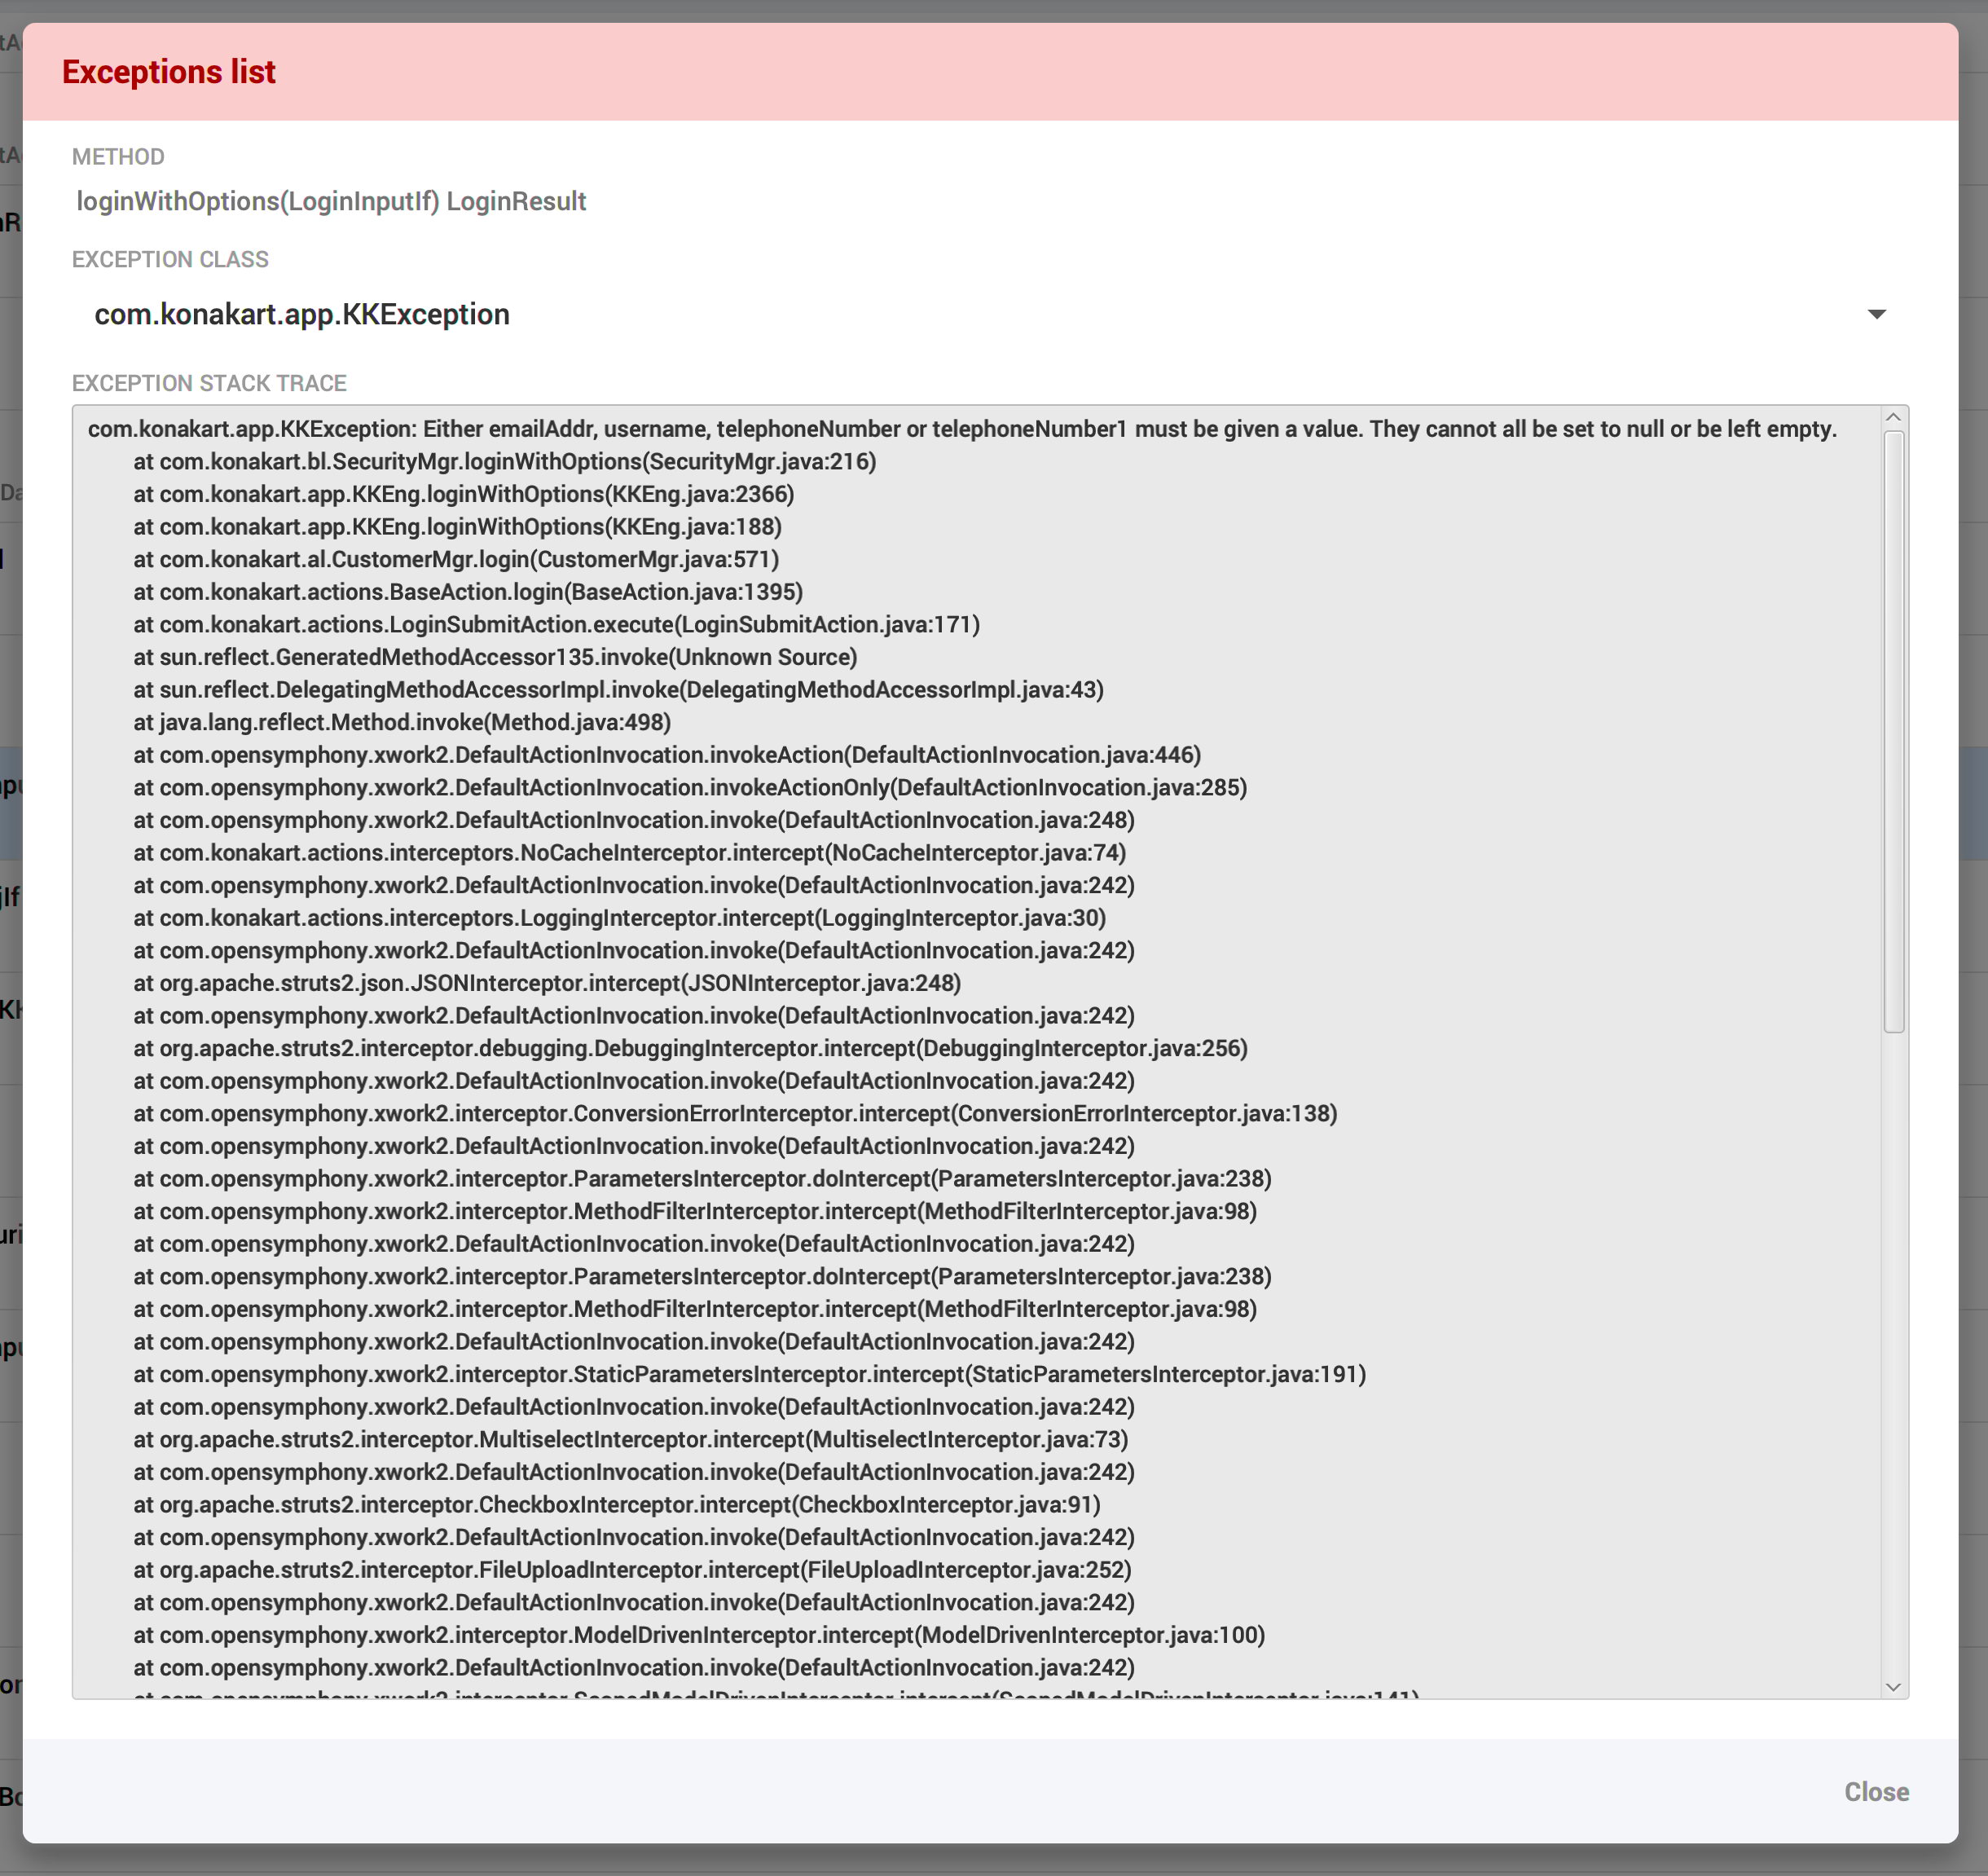
If there is more than one exception in the exceptions list, you can display a stack trace for any of the exceptions by selecting them from the EXCEPTION CLASS combo box.
Context Menu
There are several actions you can perform on the stack spectrum view. The actions are available from the context menu.
Both Get Class Bytes... and Profile items have the same meaning as in the stack tree.
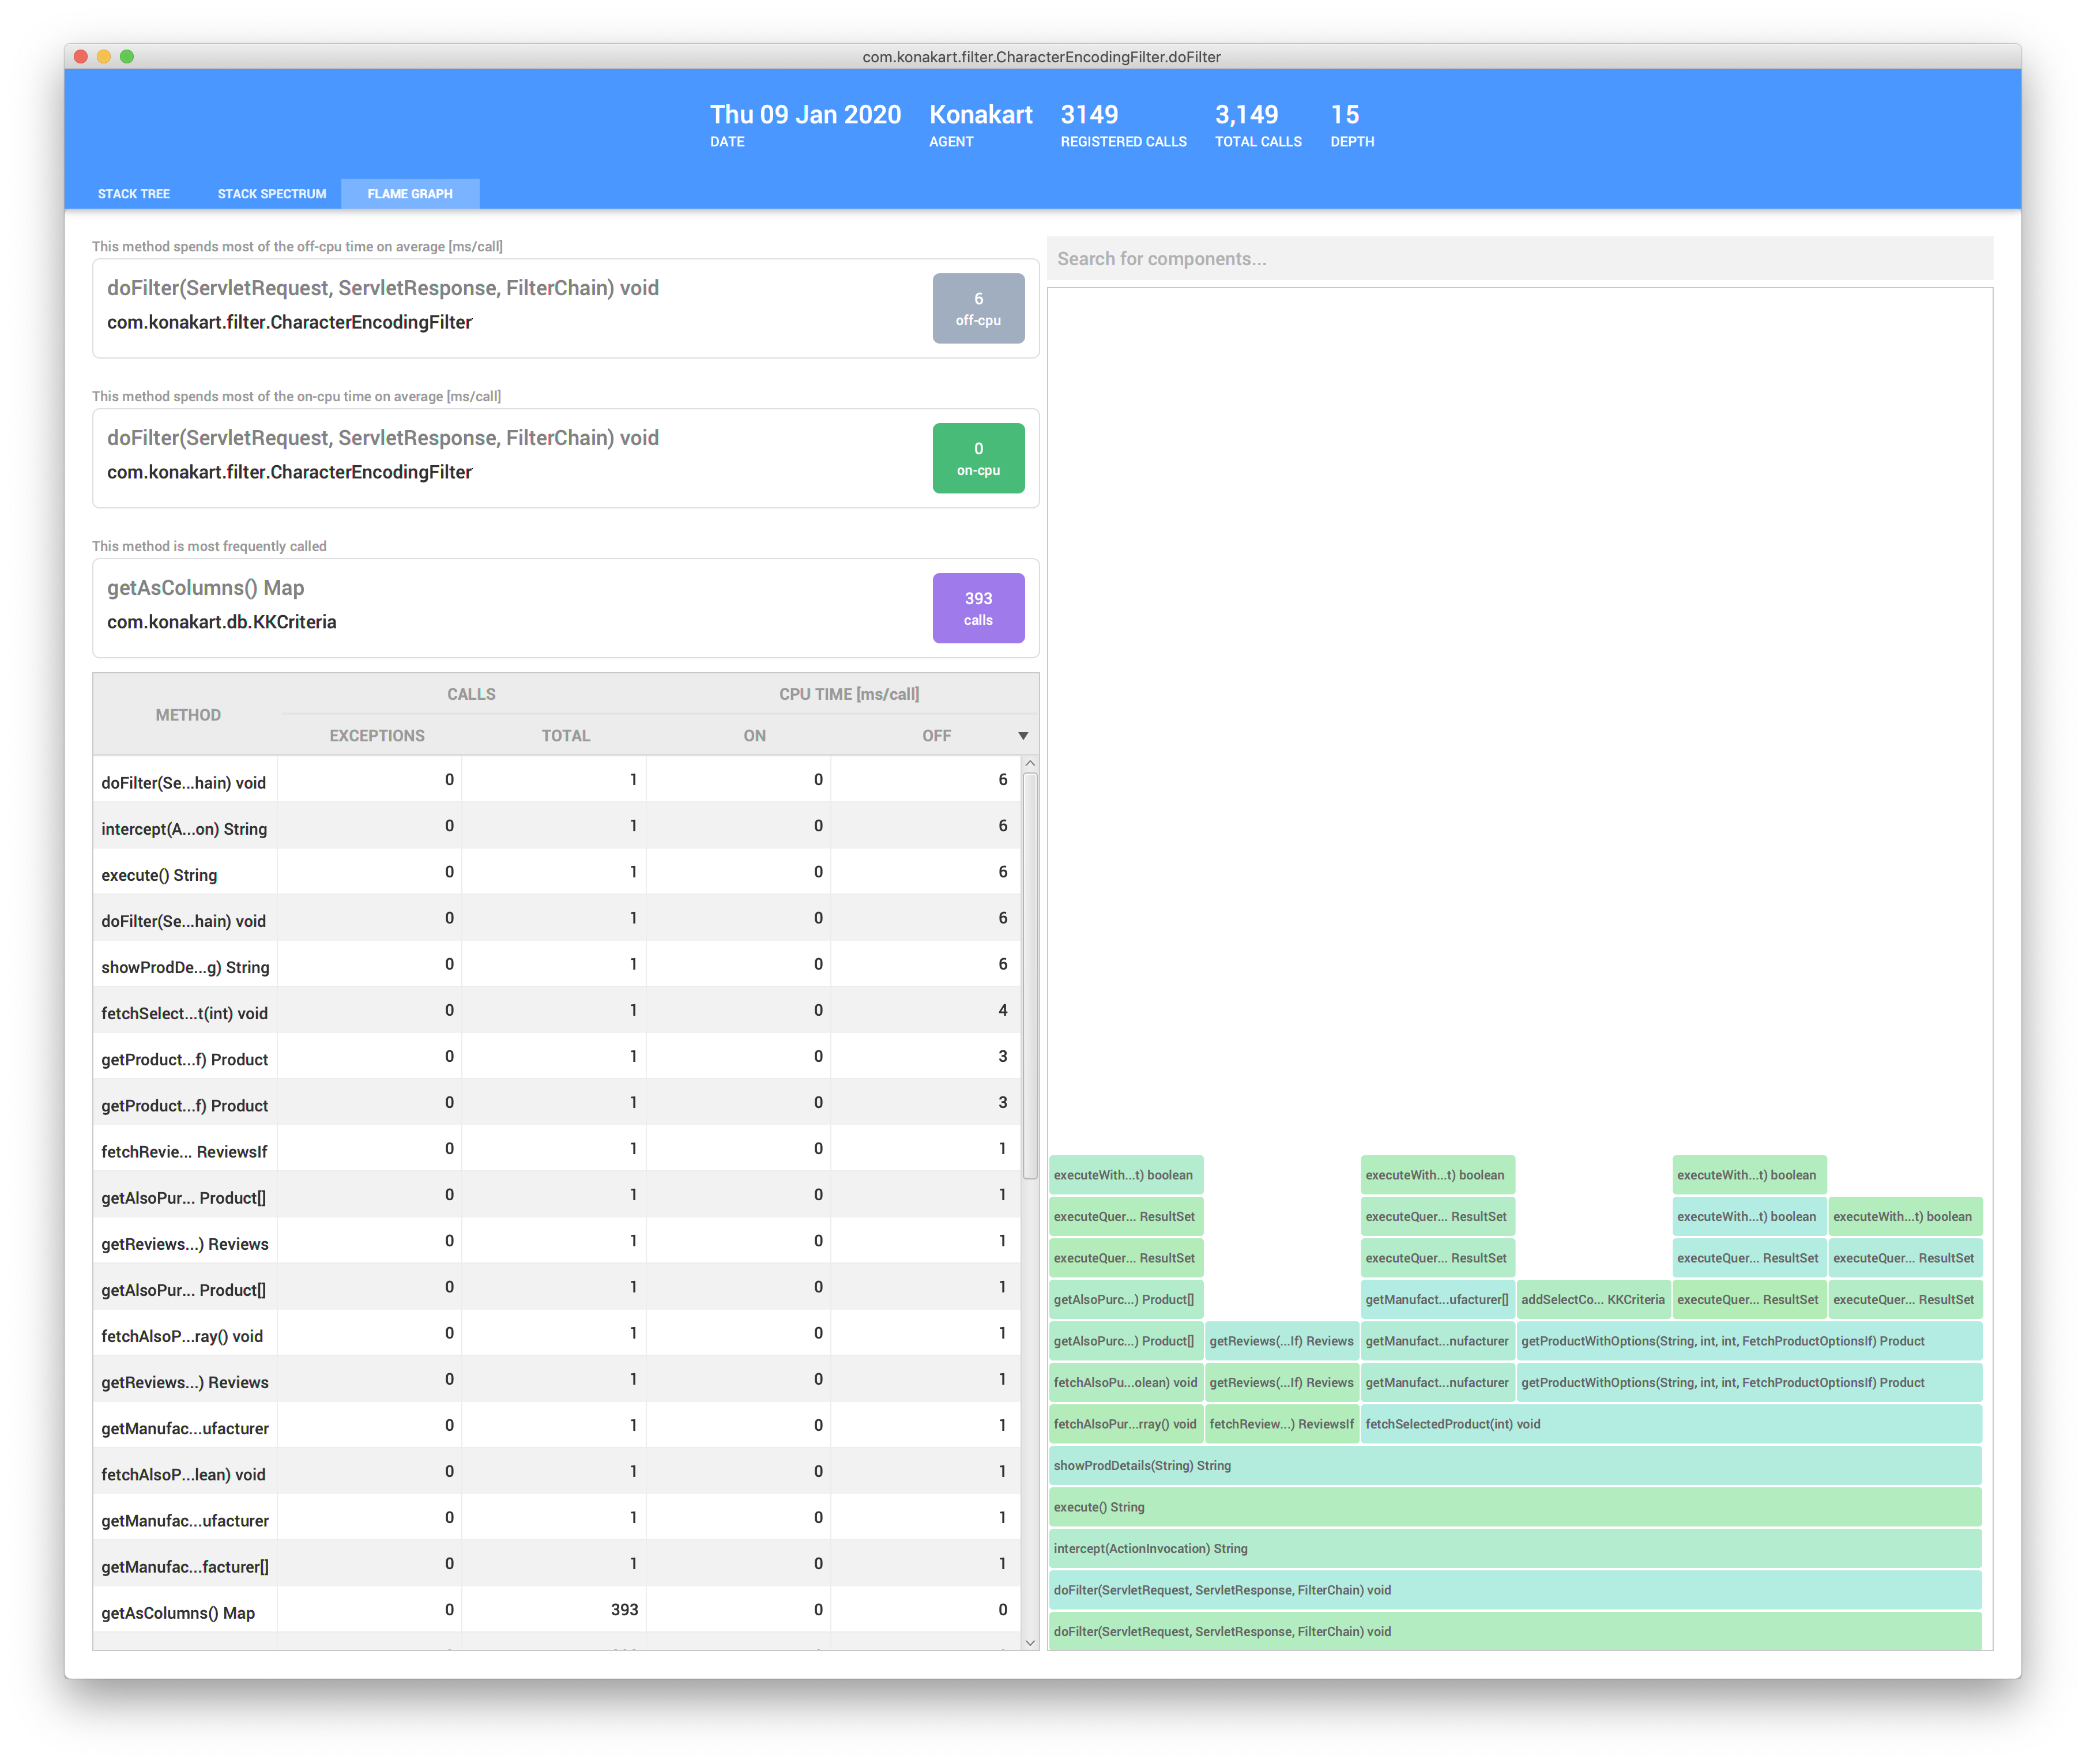
Flame Graph
When you select the FLAME GRAPH tab, you will get a view similar to the one below.
Stack Interpretation
In the picture you can see four, sample execution stacks of some A method call.
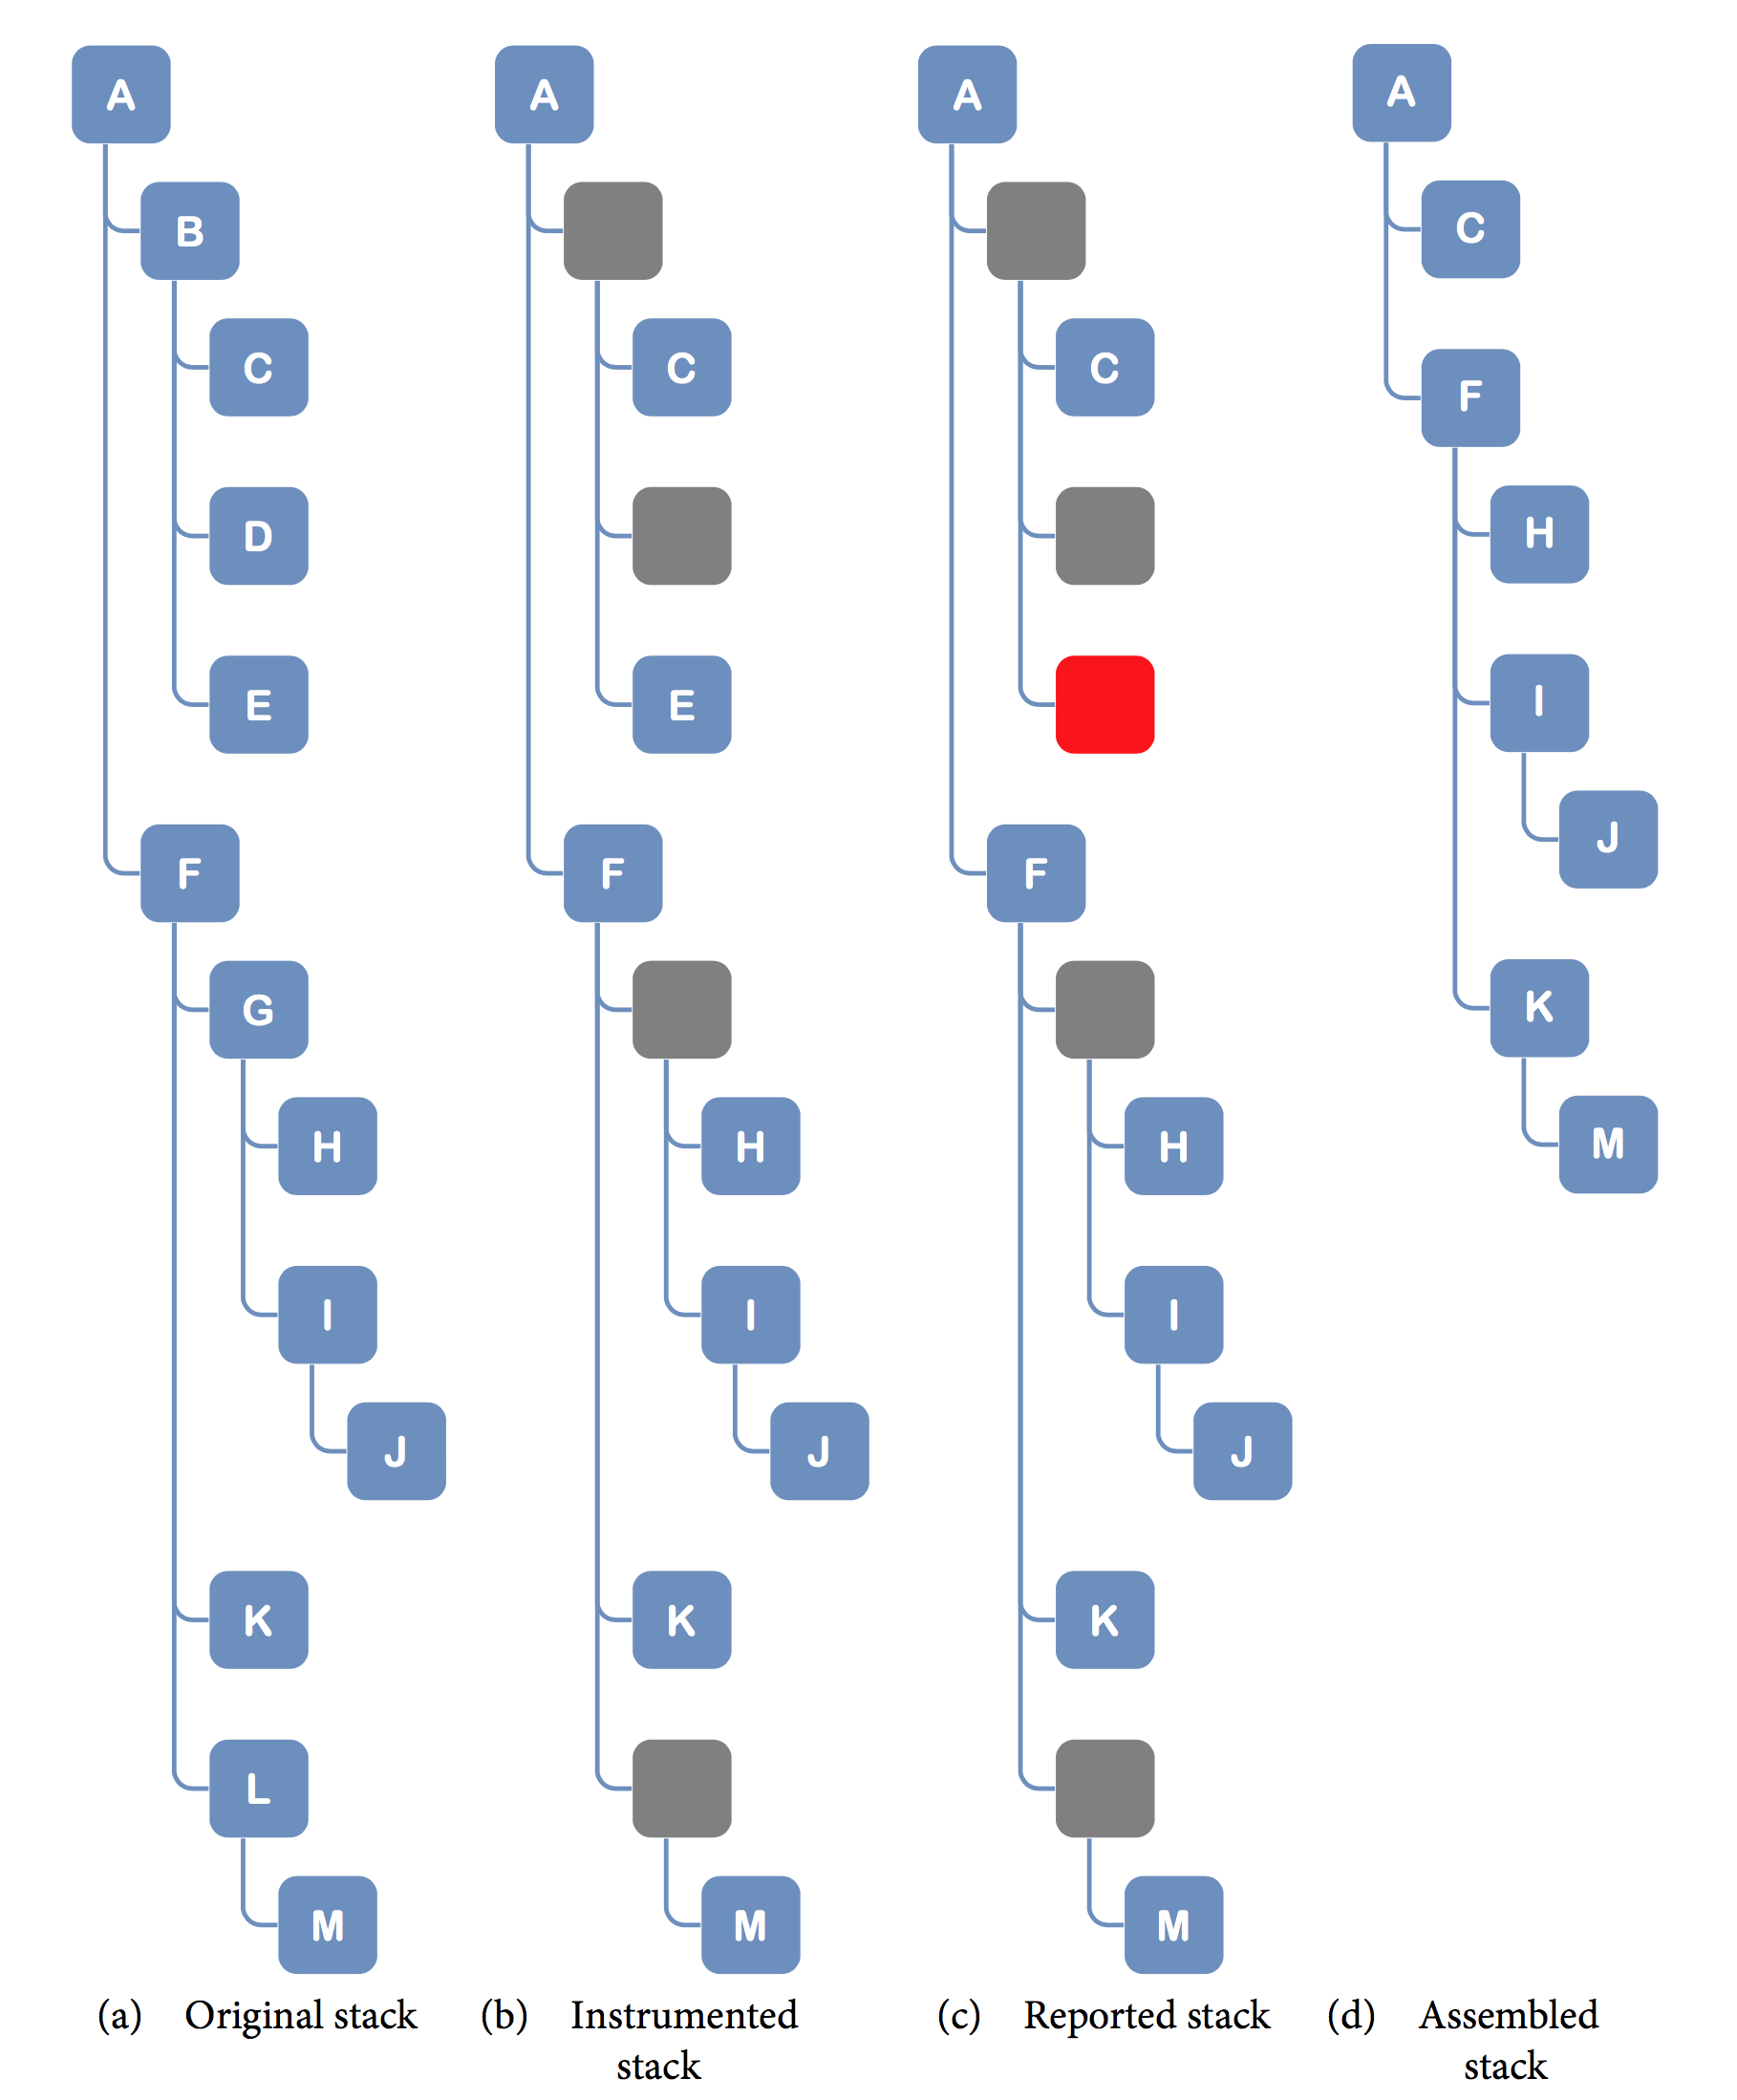
The first a view shows how the real execution stack looks. This is a real execution flow that takes place in your application. The second b view, presents the same stack instrumented by your agent. Depending on your configuration, the instrumentation may not cover the entire stack. The empty, grey boxes represent missed, not instrumented methods. As you can see, at this very point your instrumented execution flow is not complete. Moreover, in your application runtime there can be situations when some of the instrumented method calls will not be reported (refer to Data Collecting Considerations for details). The empty, red boxes in the third c view represent this situation. Finally, what you actually observe in workstation is the last d view. This view presents an assembled stack with missing calls ignored. Now you know how to interpret the execution stack in workstation and why the resulting stack can differ from the original one.