Agents Status
Agent Details
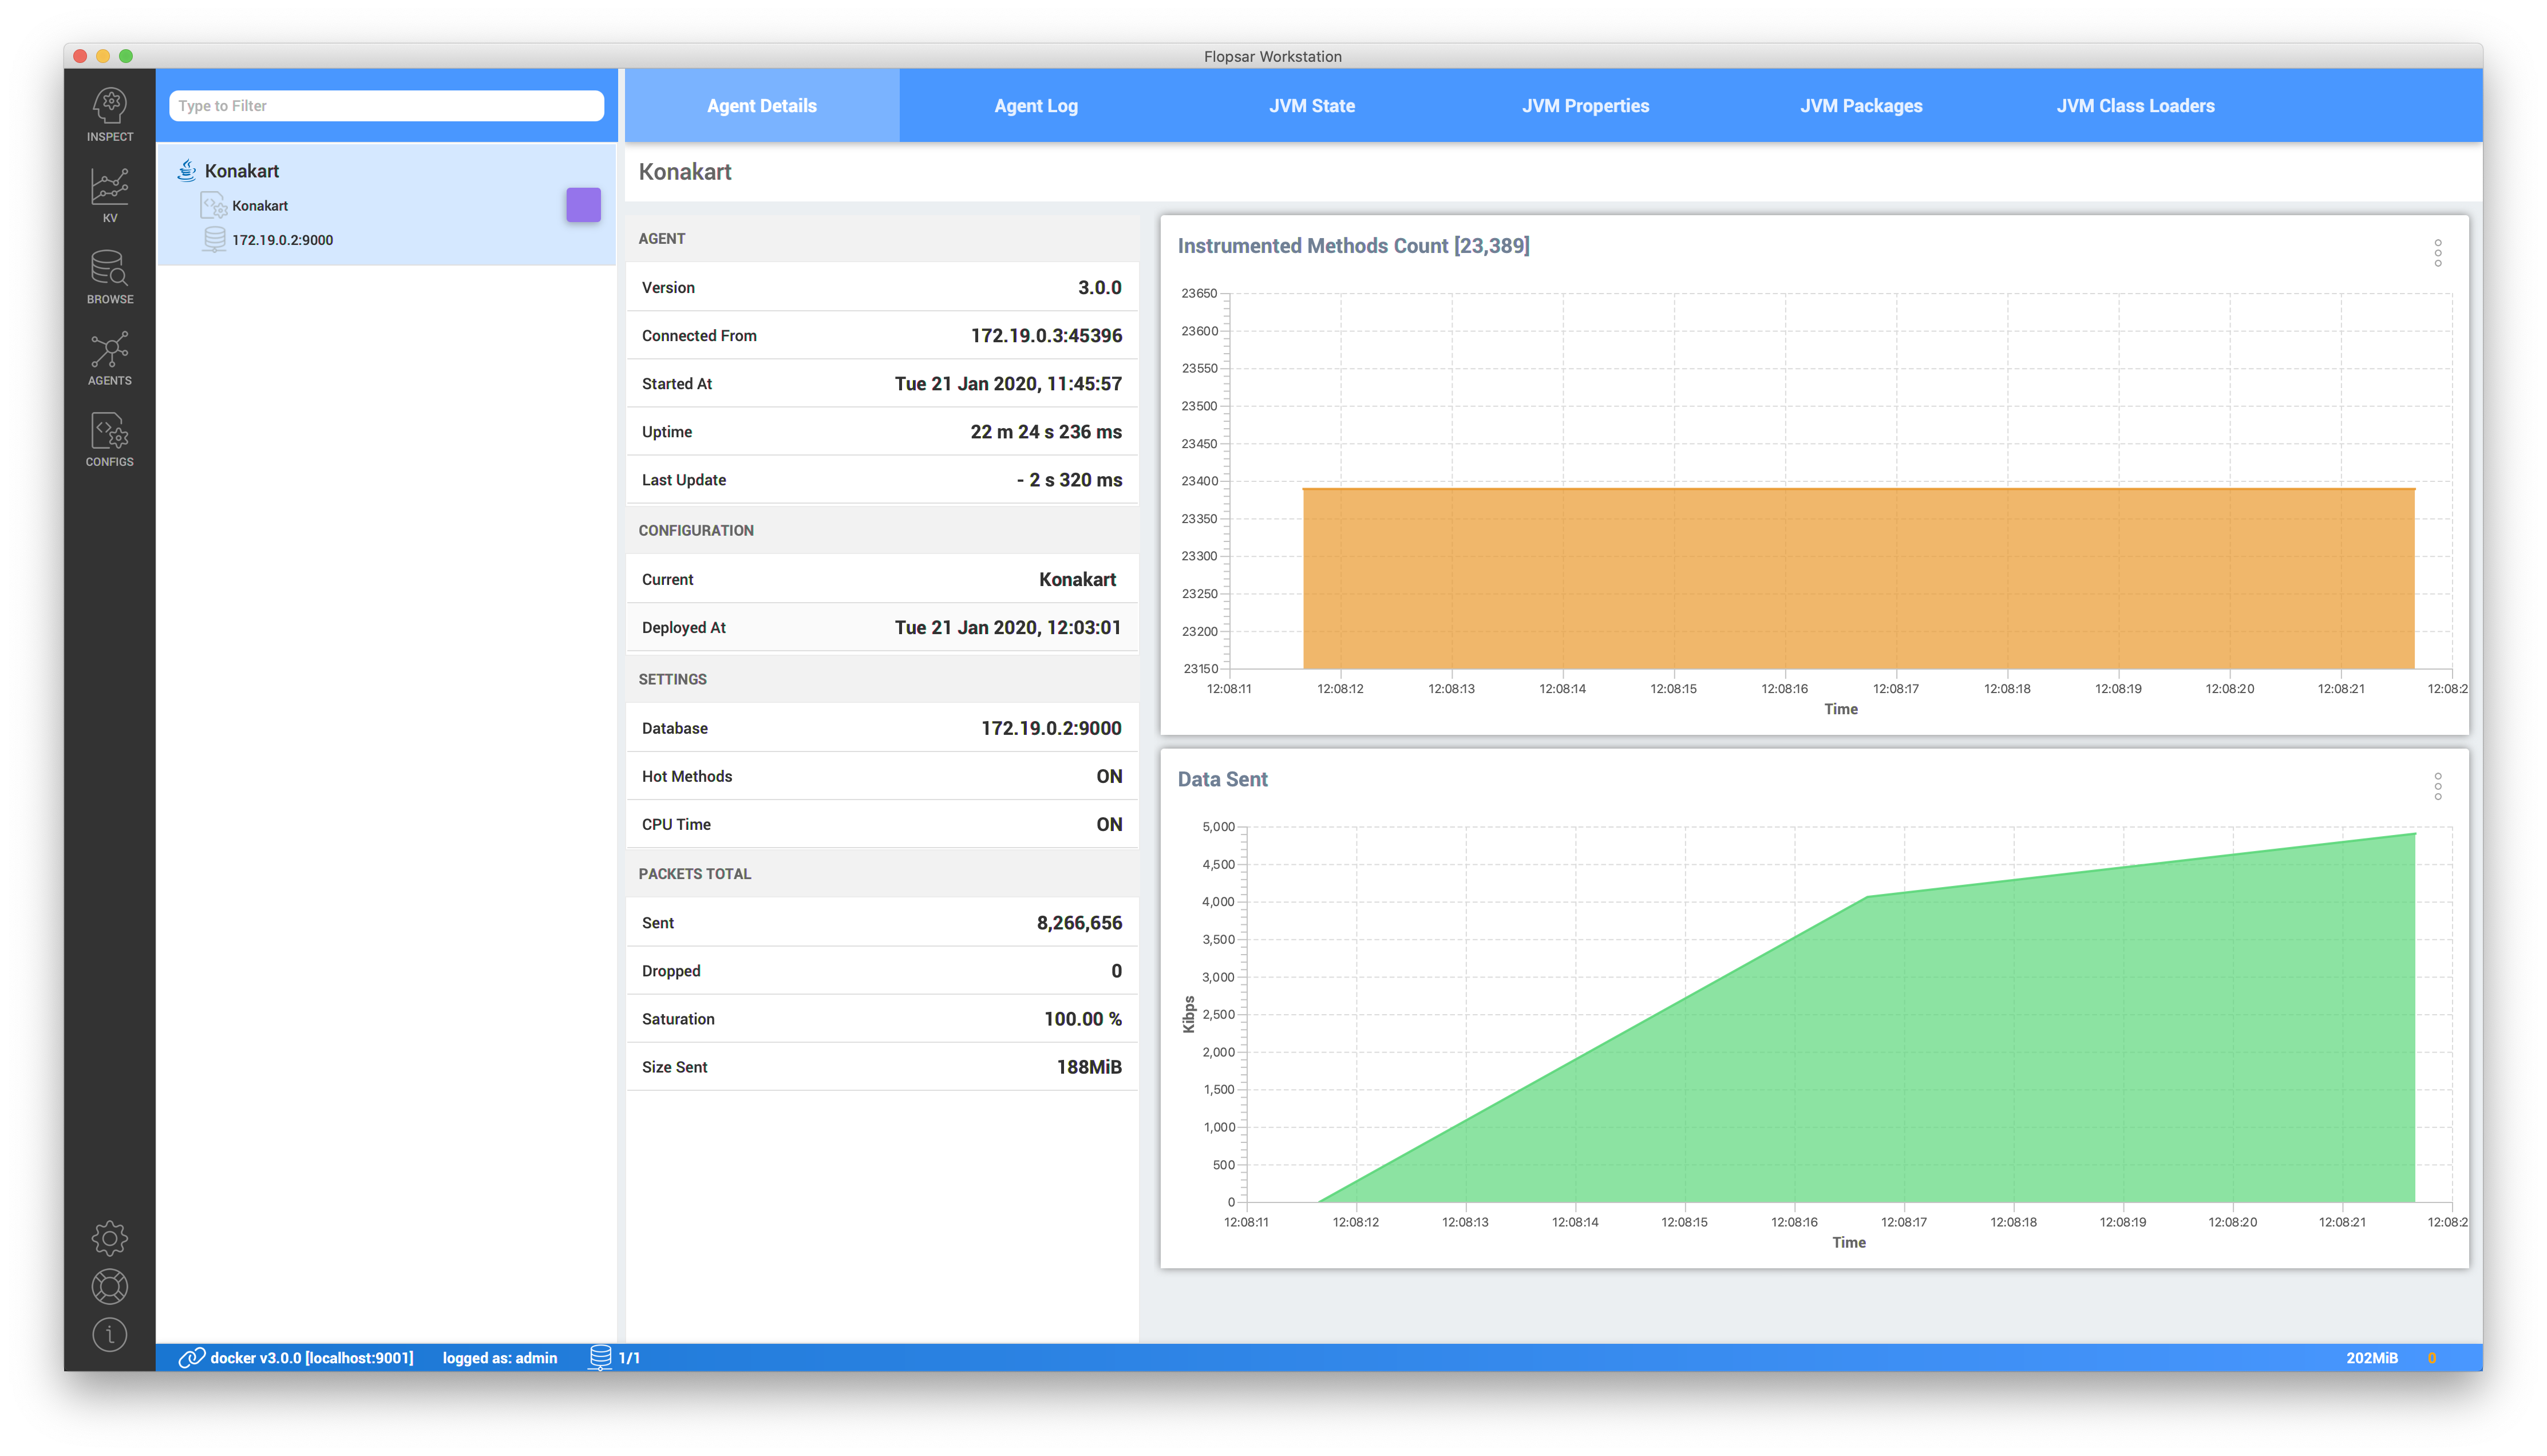
The view is divided into panes with either text information or a graph on them. All the information in this view is reported by the agent. The reported data are collected since the agent started and reset every time the agent restarts.
The following details are reported in the view.
- Agent
- Configuration
- Settings
- Packets Total
Version : version of the agent.
Connected From : source socket address of the agent. It shows from which socket address the agent connects to manager.
Started At : agent startup time. It shows when the agent started.
Uptime : agent uptime time. It shows how long the agent is up.
Last update : agent last report time. It shows how much time has passed since the last agent report received by Workstation.
Current : current configuration. It shows the configuration the agent is attached to.
Deployed At : agent configuration deployment time. It shows the last time the configuration has been deployed to the agent.
Database : current database. It shows the database the agent sends its data to.
Hot Methods : Hot Methods feature. It shows whether the feature is enabled or disabled.
CPU Time : CPU time feature. It shows whether the CPU time measurement is enabled or disabled.
Sent : Number of sent packets. Each method call, symbol or some metric value is represented as a single packet. These packets are sent to a database. This shows the total number of such packets sent to the database from the moment of the agent start. If the agent is attached to another database, this value will be reset.
Dropped : Number of dropped packets. It shows the number of packets that have been dropped inside the agents. There can be a few reasons which make the agent to drop packets. See Data Collecting Considerations for details.
Saturation : Packets saturation. It shows the ratio of the number of received packets to the total number of packets. This total number is a sum of dropped and received packets. The value is displayed in percentages. If the value is 100% it means that all the packets, that have been collected on the agent, have been received by the database. If this value is low, it means that a large number of packets is dropped for some reason.
Size Sent : Data size sent. It shows how much data has been sent to the database. This value is counted from the moment of the agent start. If the agent is attached to another database, this value will be reset.
Additionally, there are two graphs that present current number of instrumented methods and the current outbound size of data sent from the agent.
Agent Logs
In the Agent Log tab, you can control the current agent log level and monitor the number of logged messages with respect to their log level. The number is counted from the moment the agent starts. If you want to change the current log level, just click the level in the white box and select a new level.
If you want to see recent agent logs, you can retrieve them from the agent by clicking the green download button. It will retrieve up to 1 MB of recent logs.
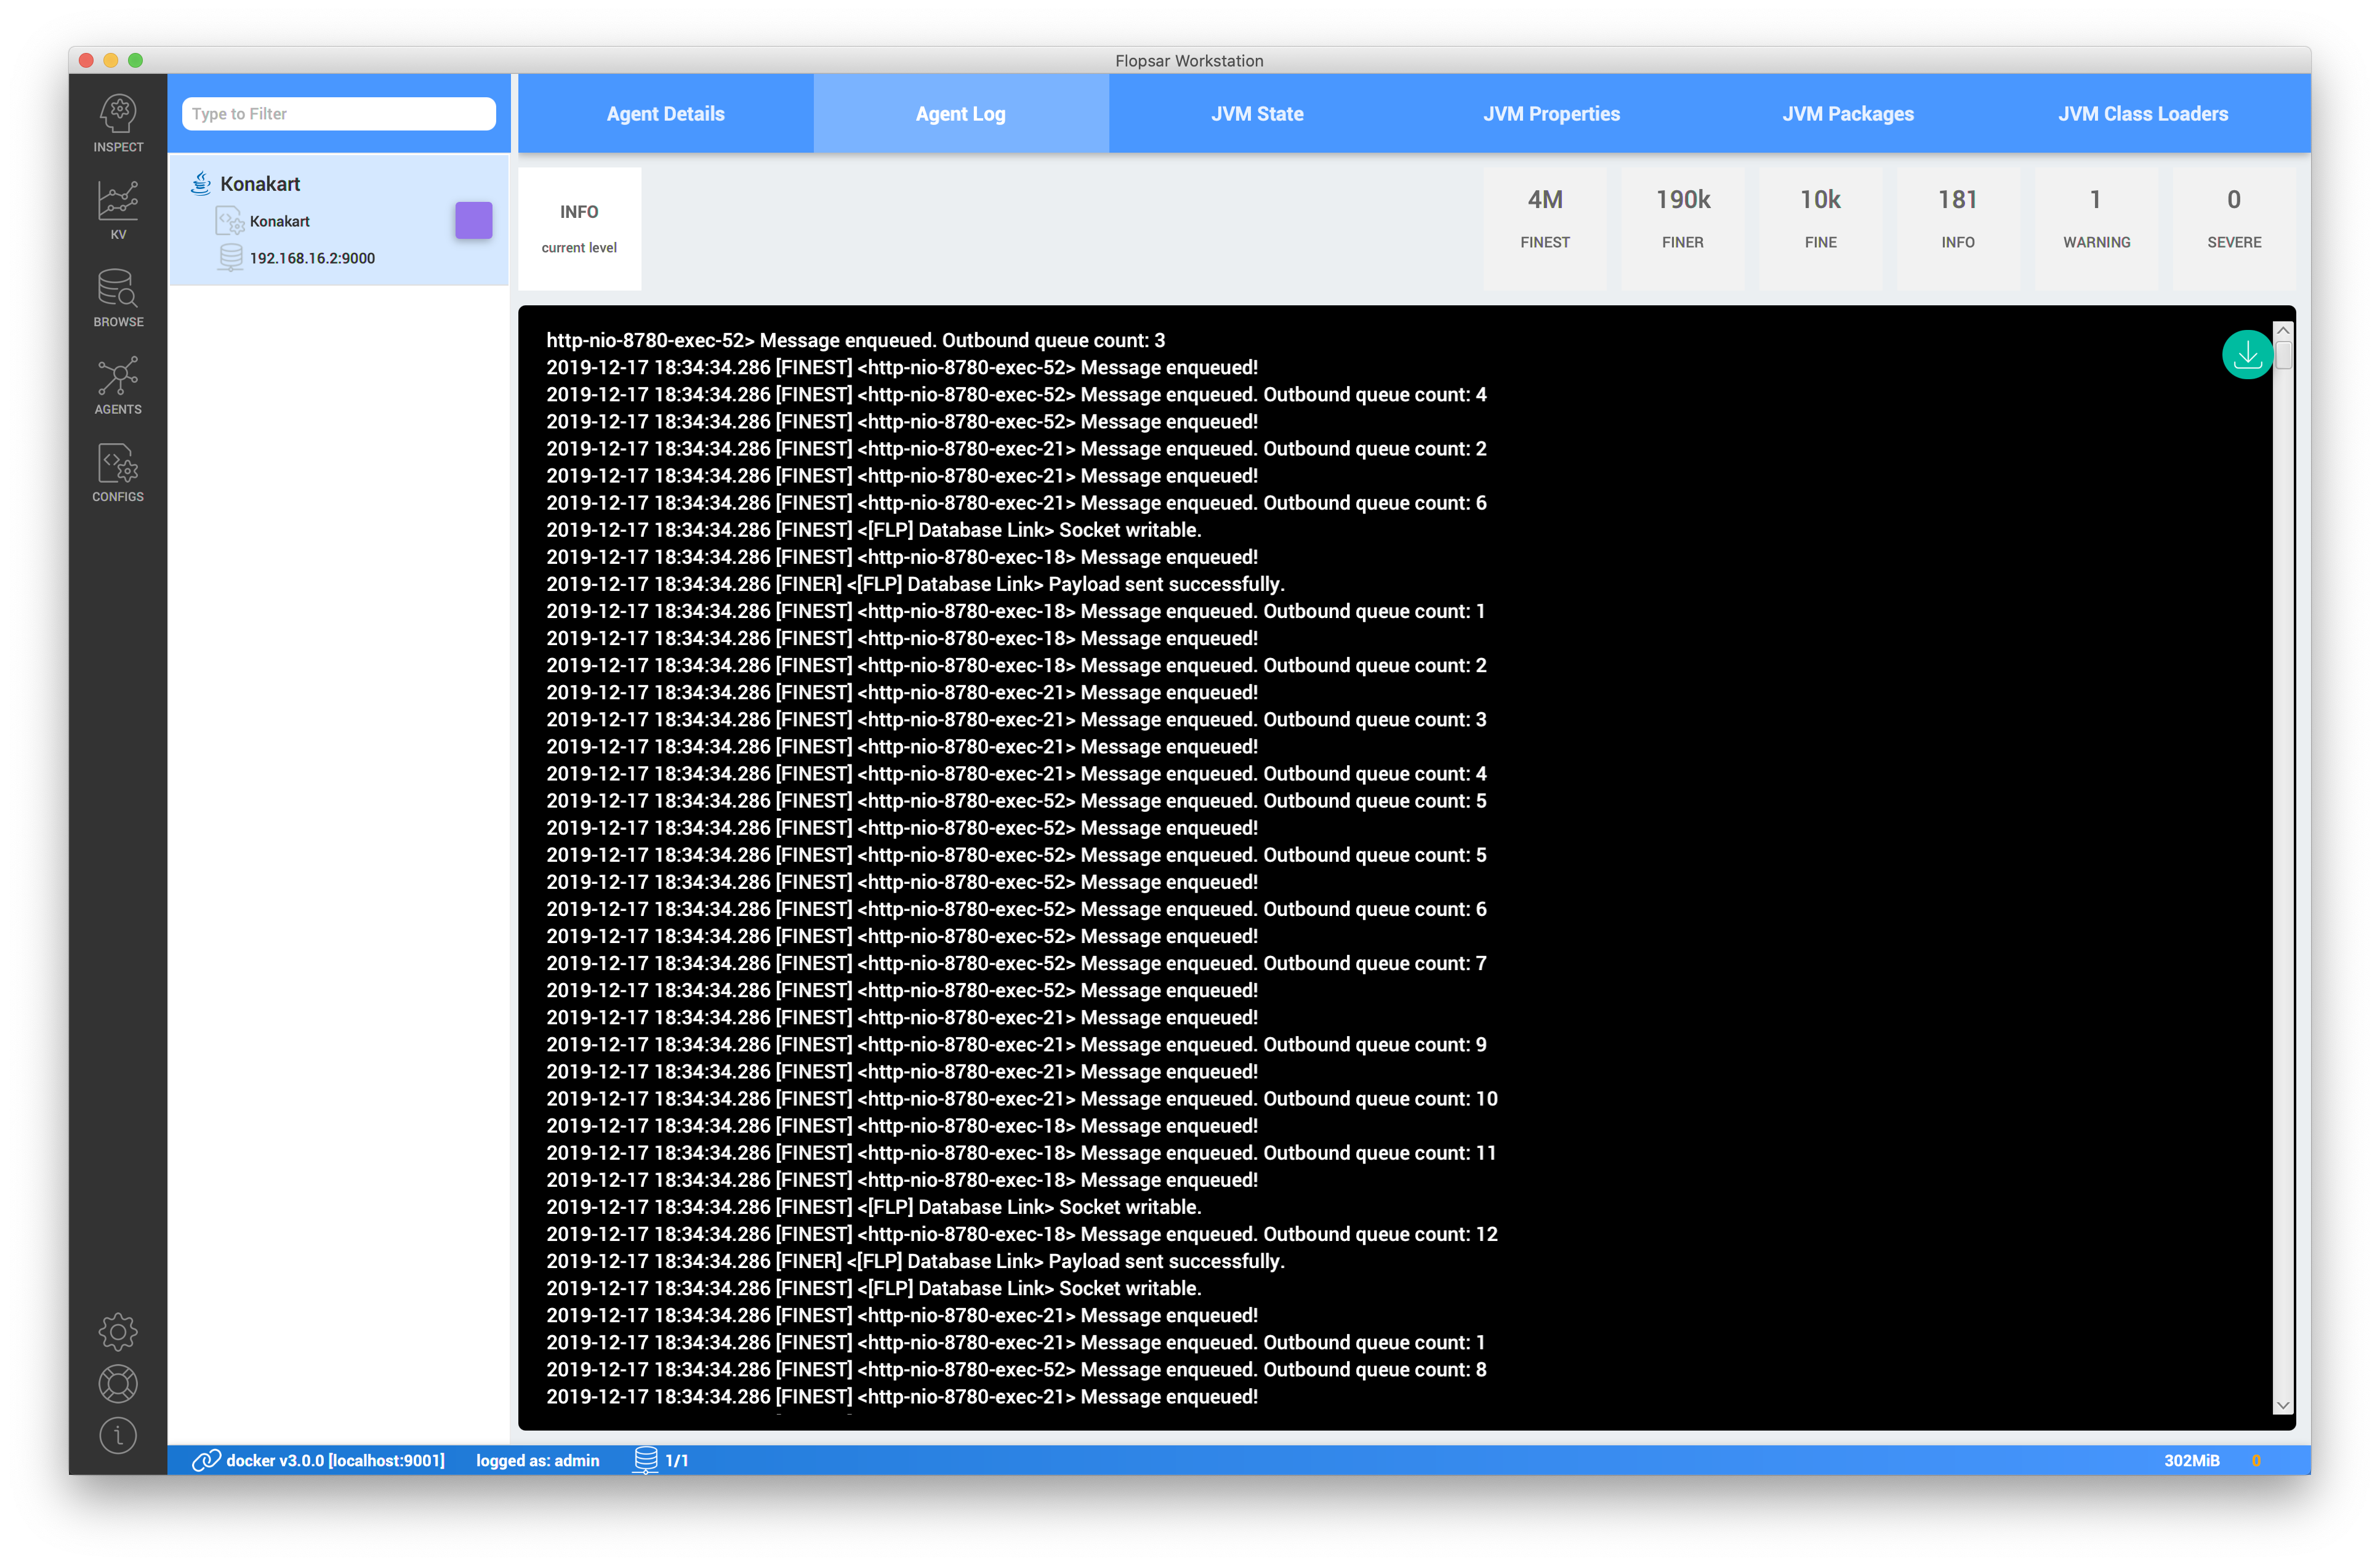
You can change the logger level by selecting the level from the current level tile.
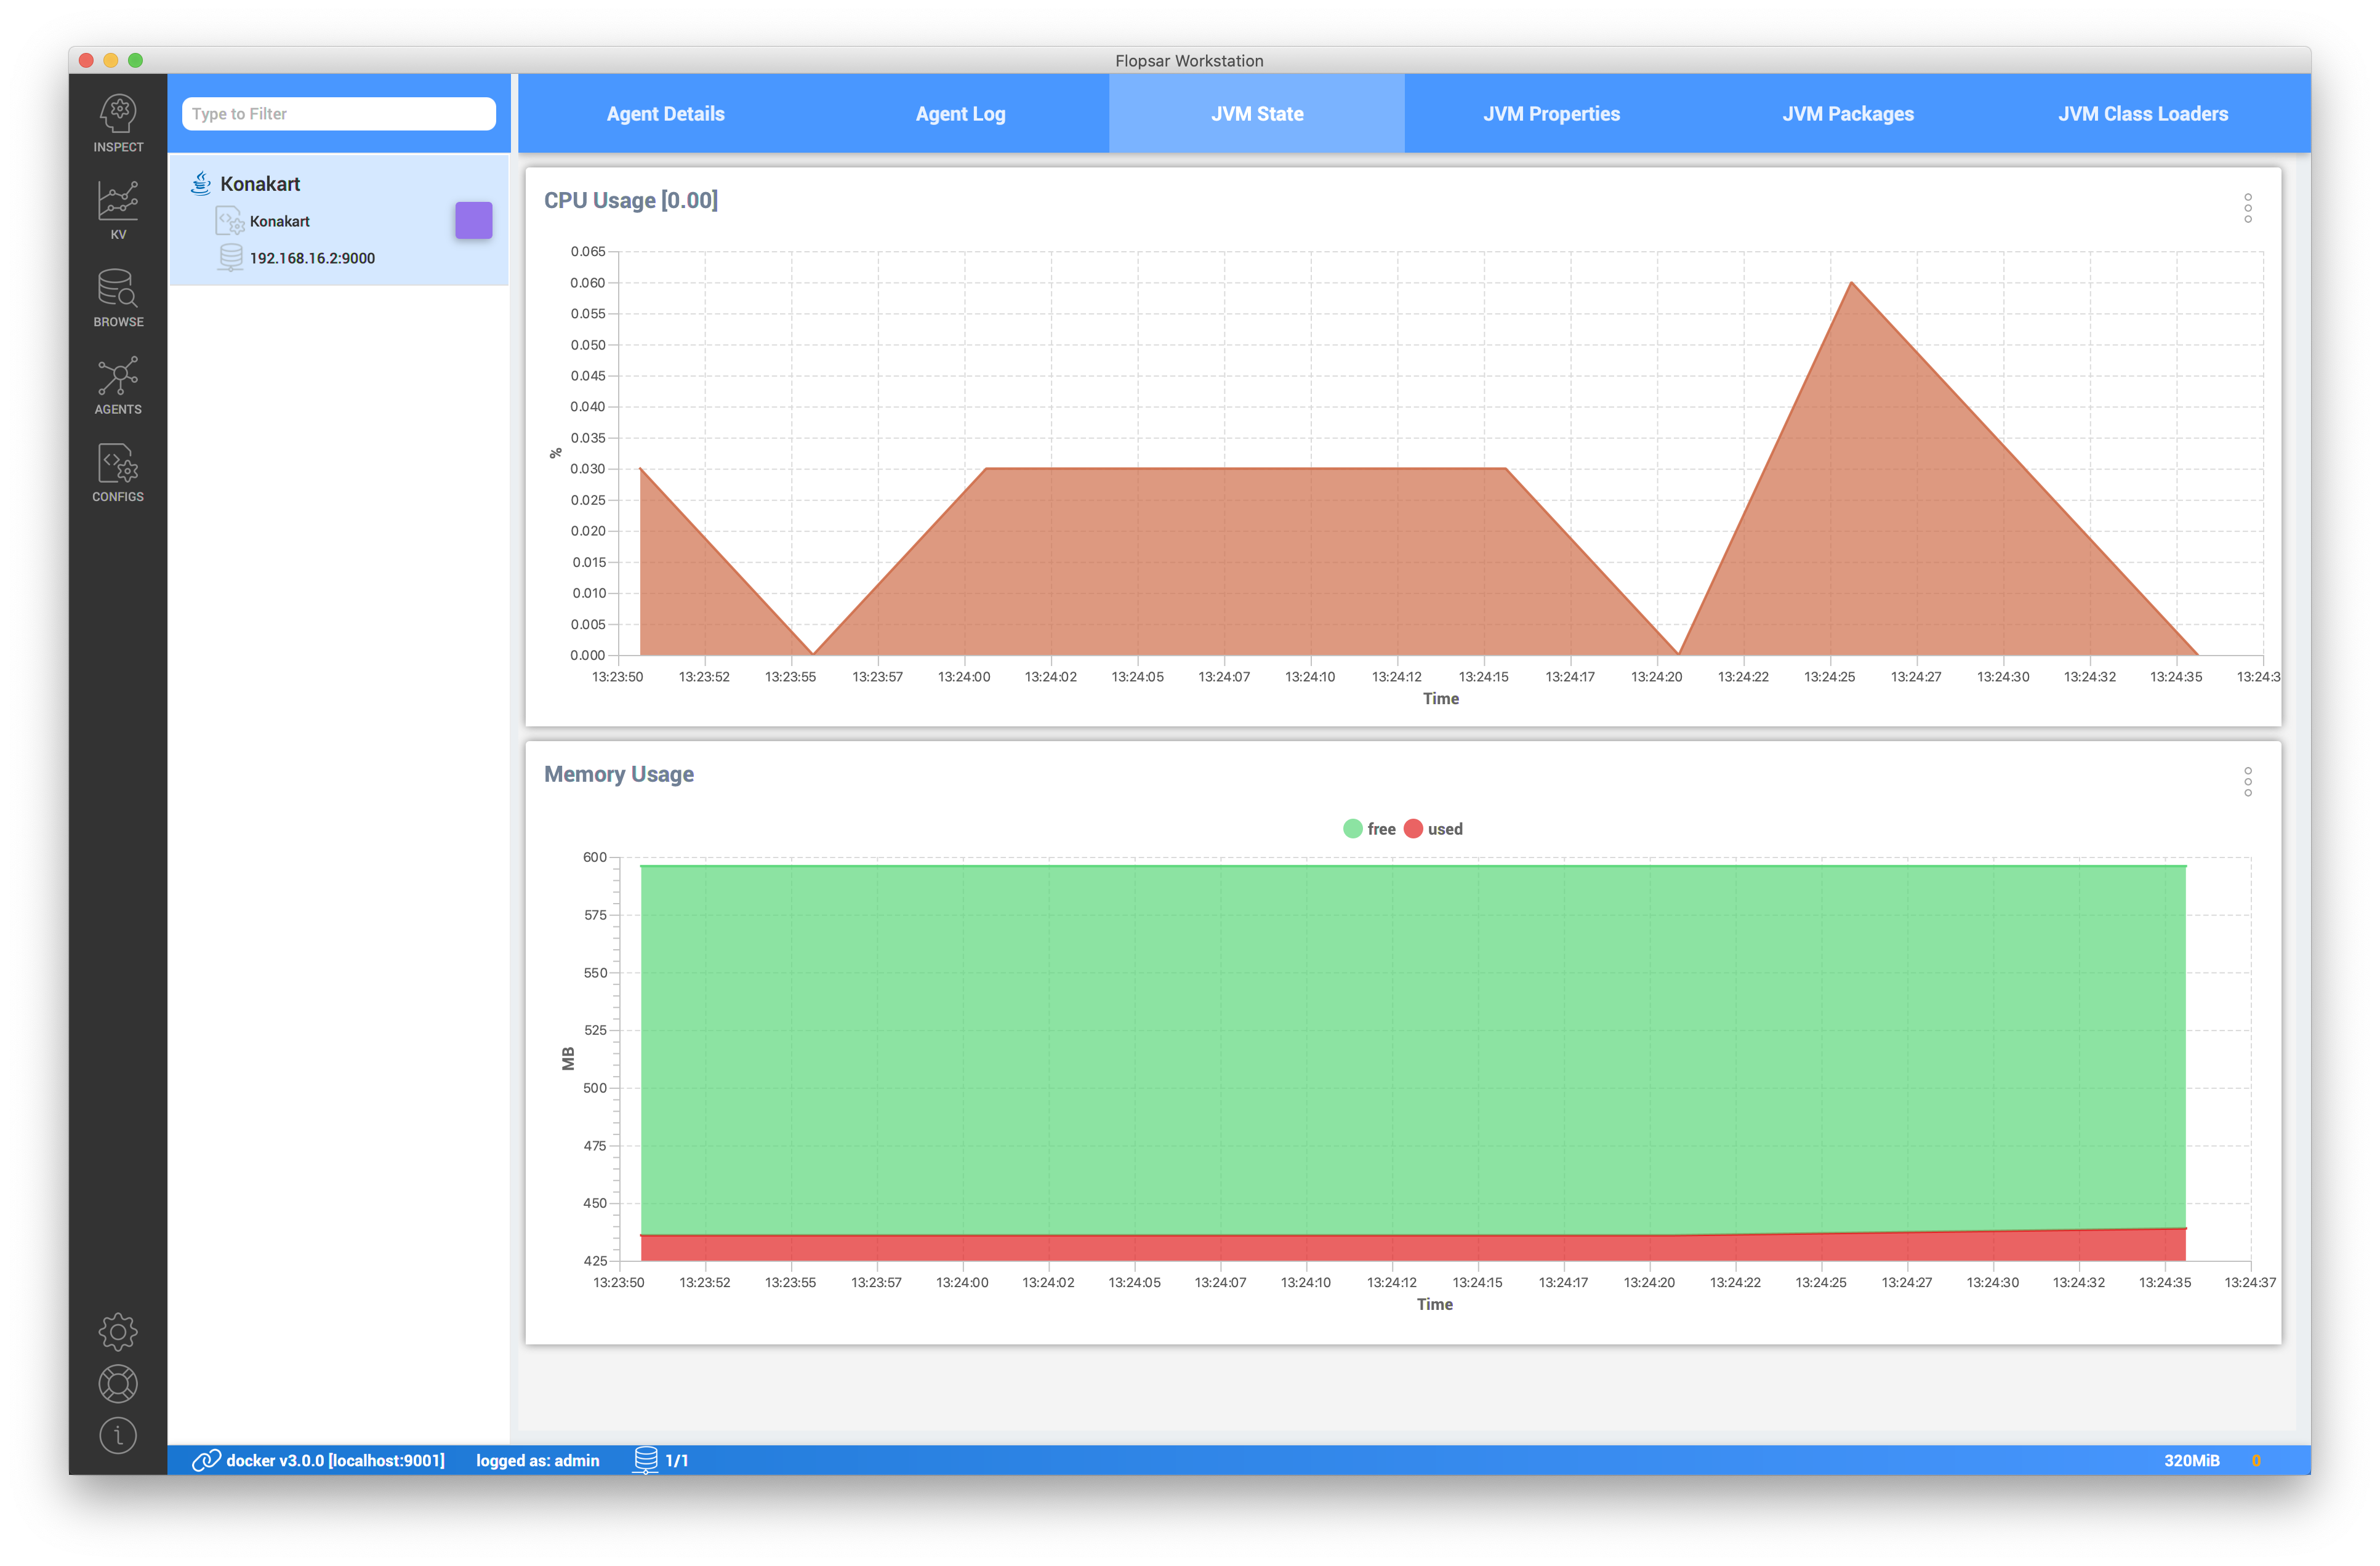
JVM State
This view presents CPU and memory usage graphs of the selected JVM.
CPU usage graph is supported only for GNU/Linux platforms.
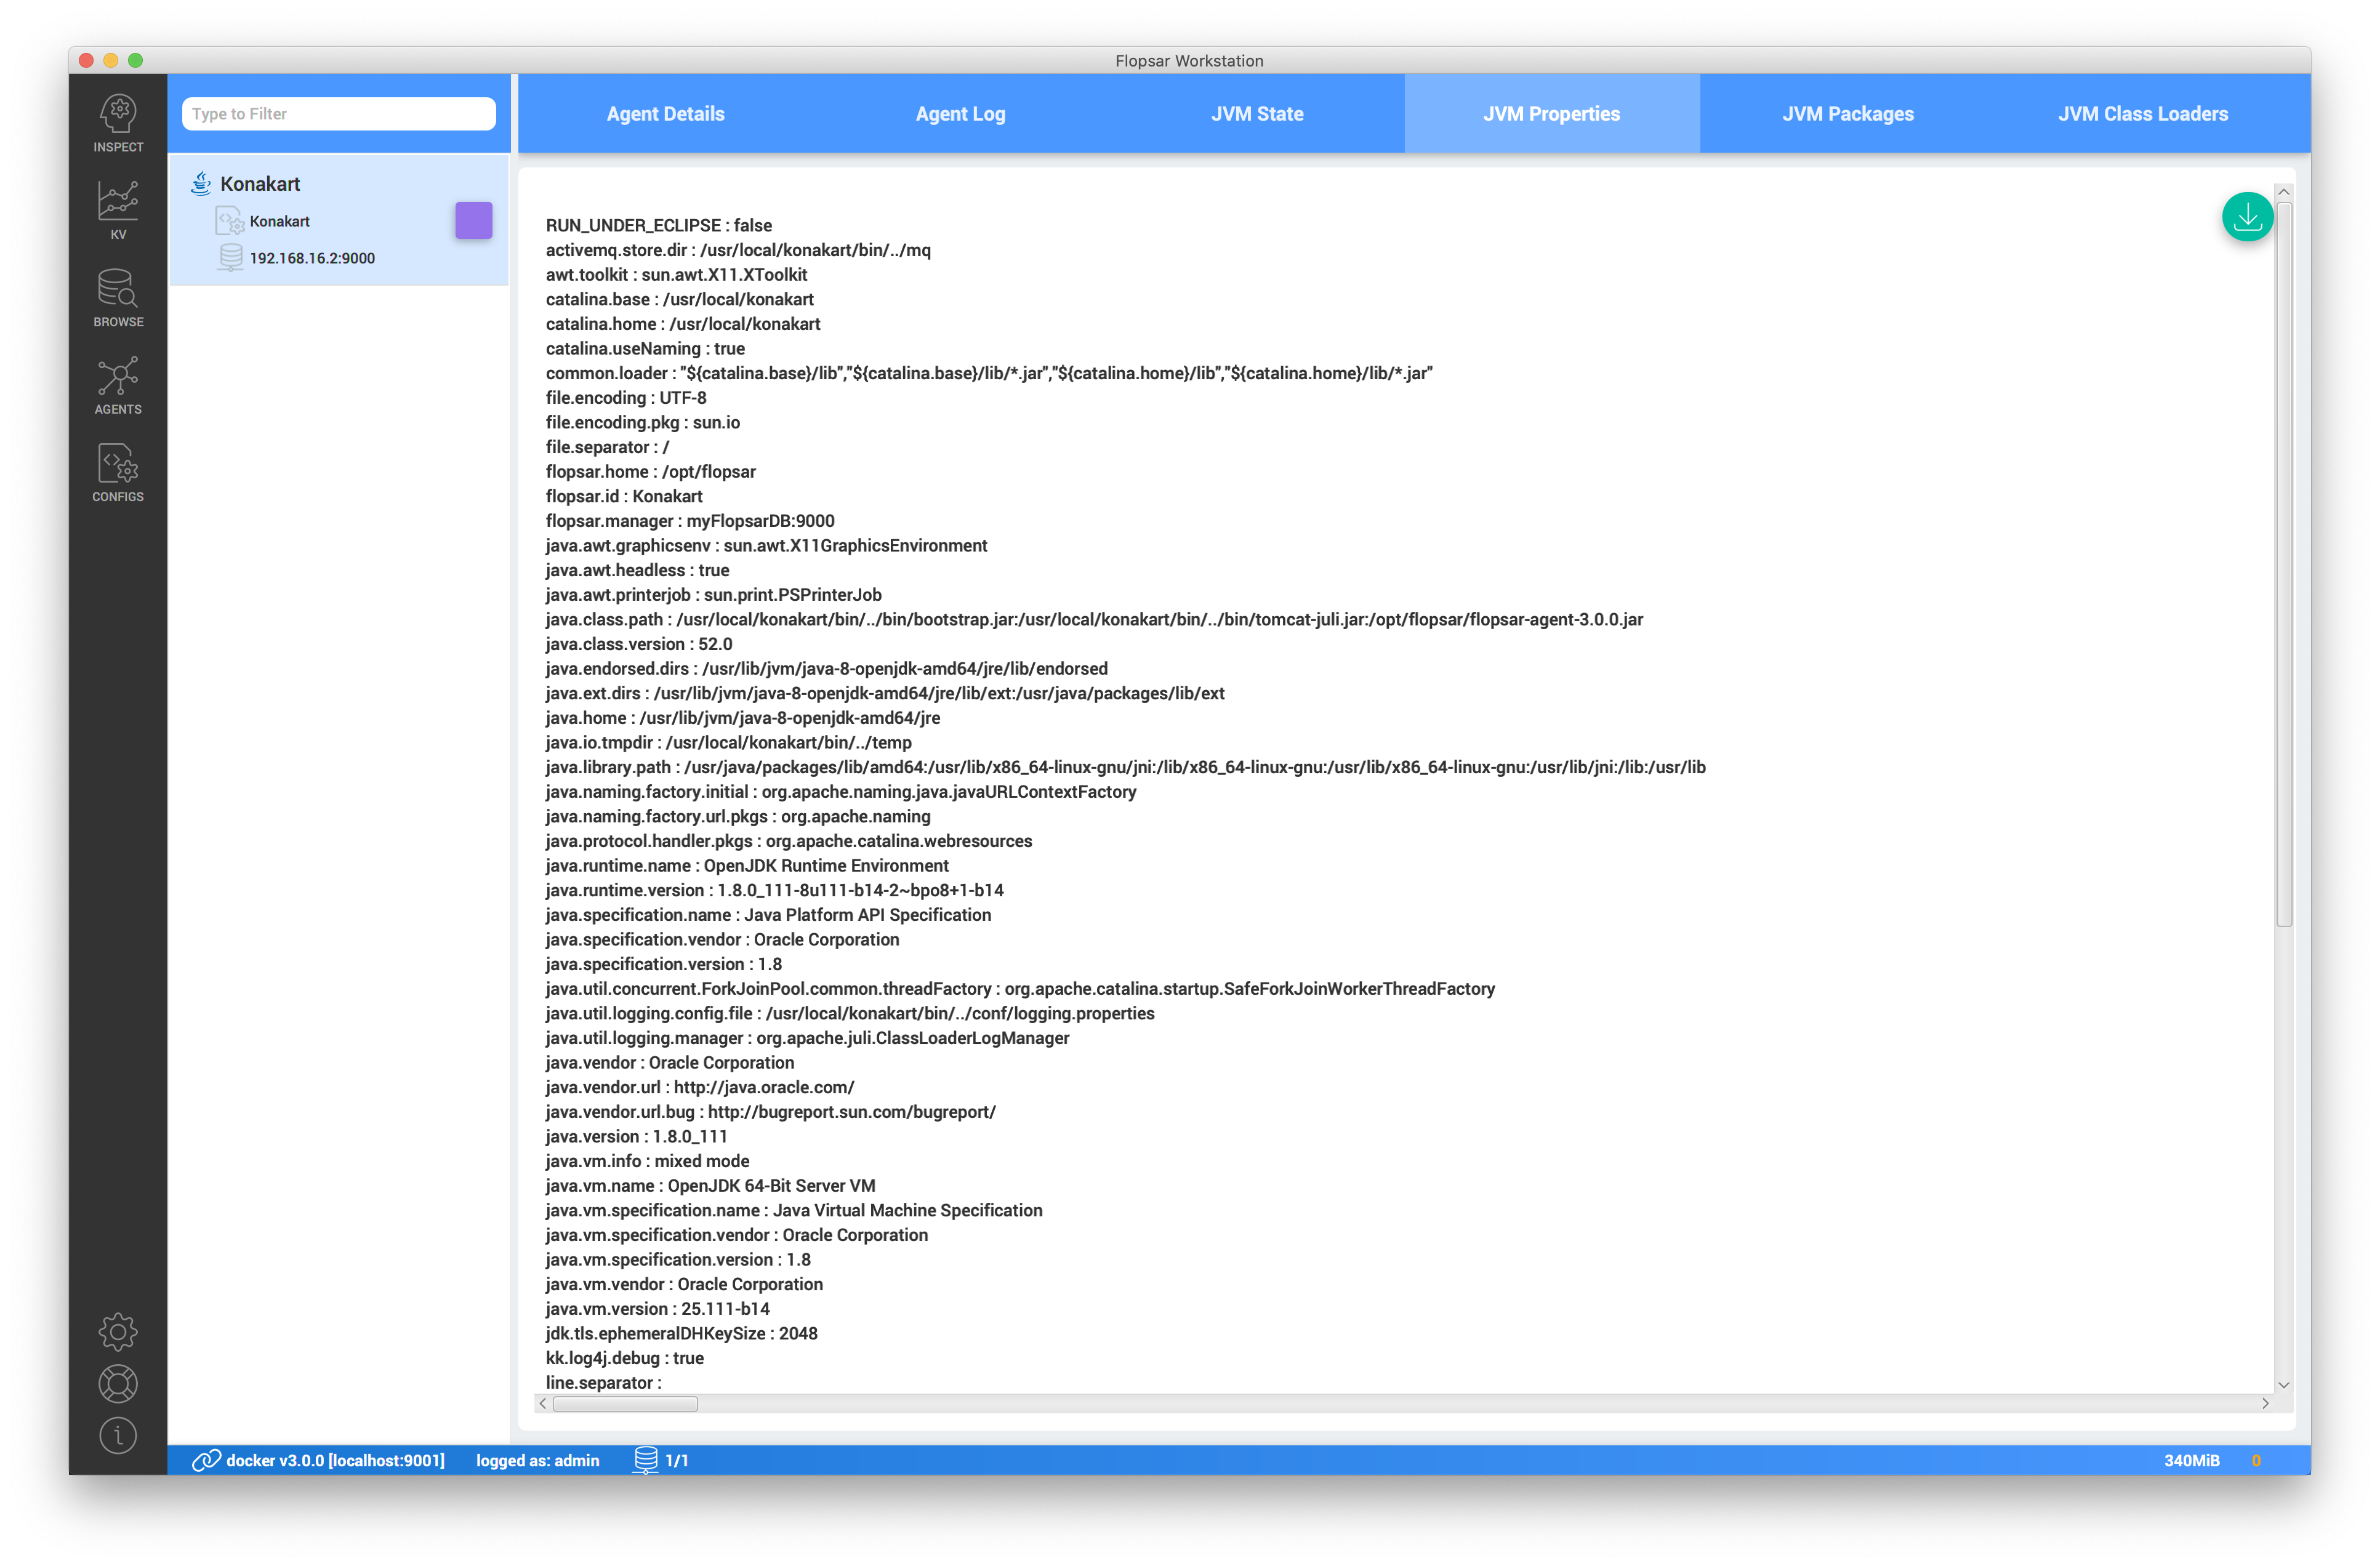
JVM Properties
In this view you can retrieve JVM system properties.
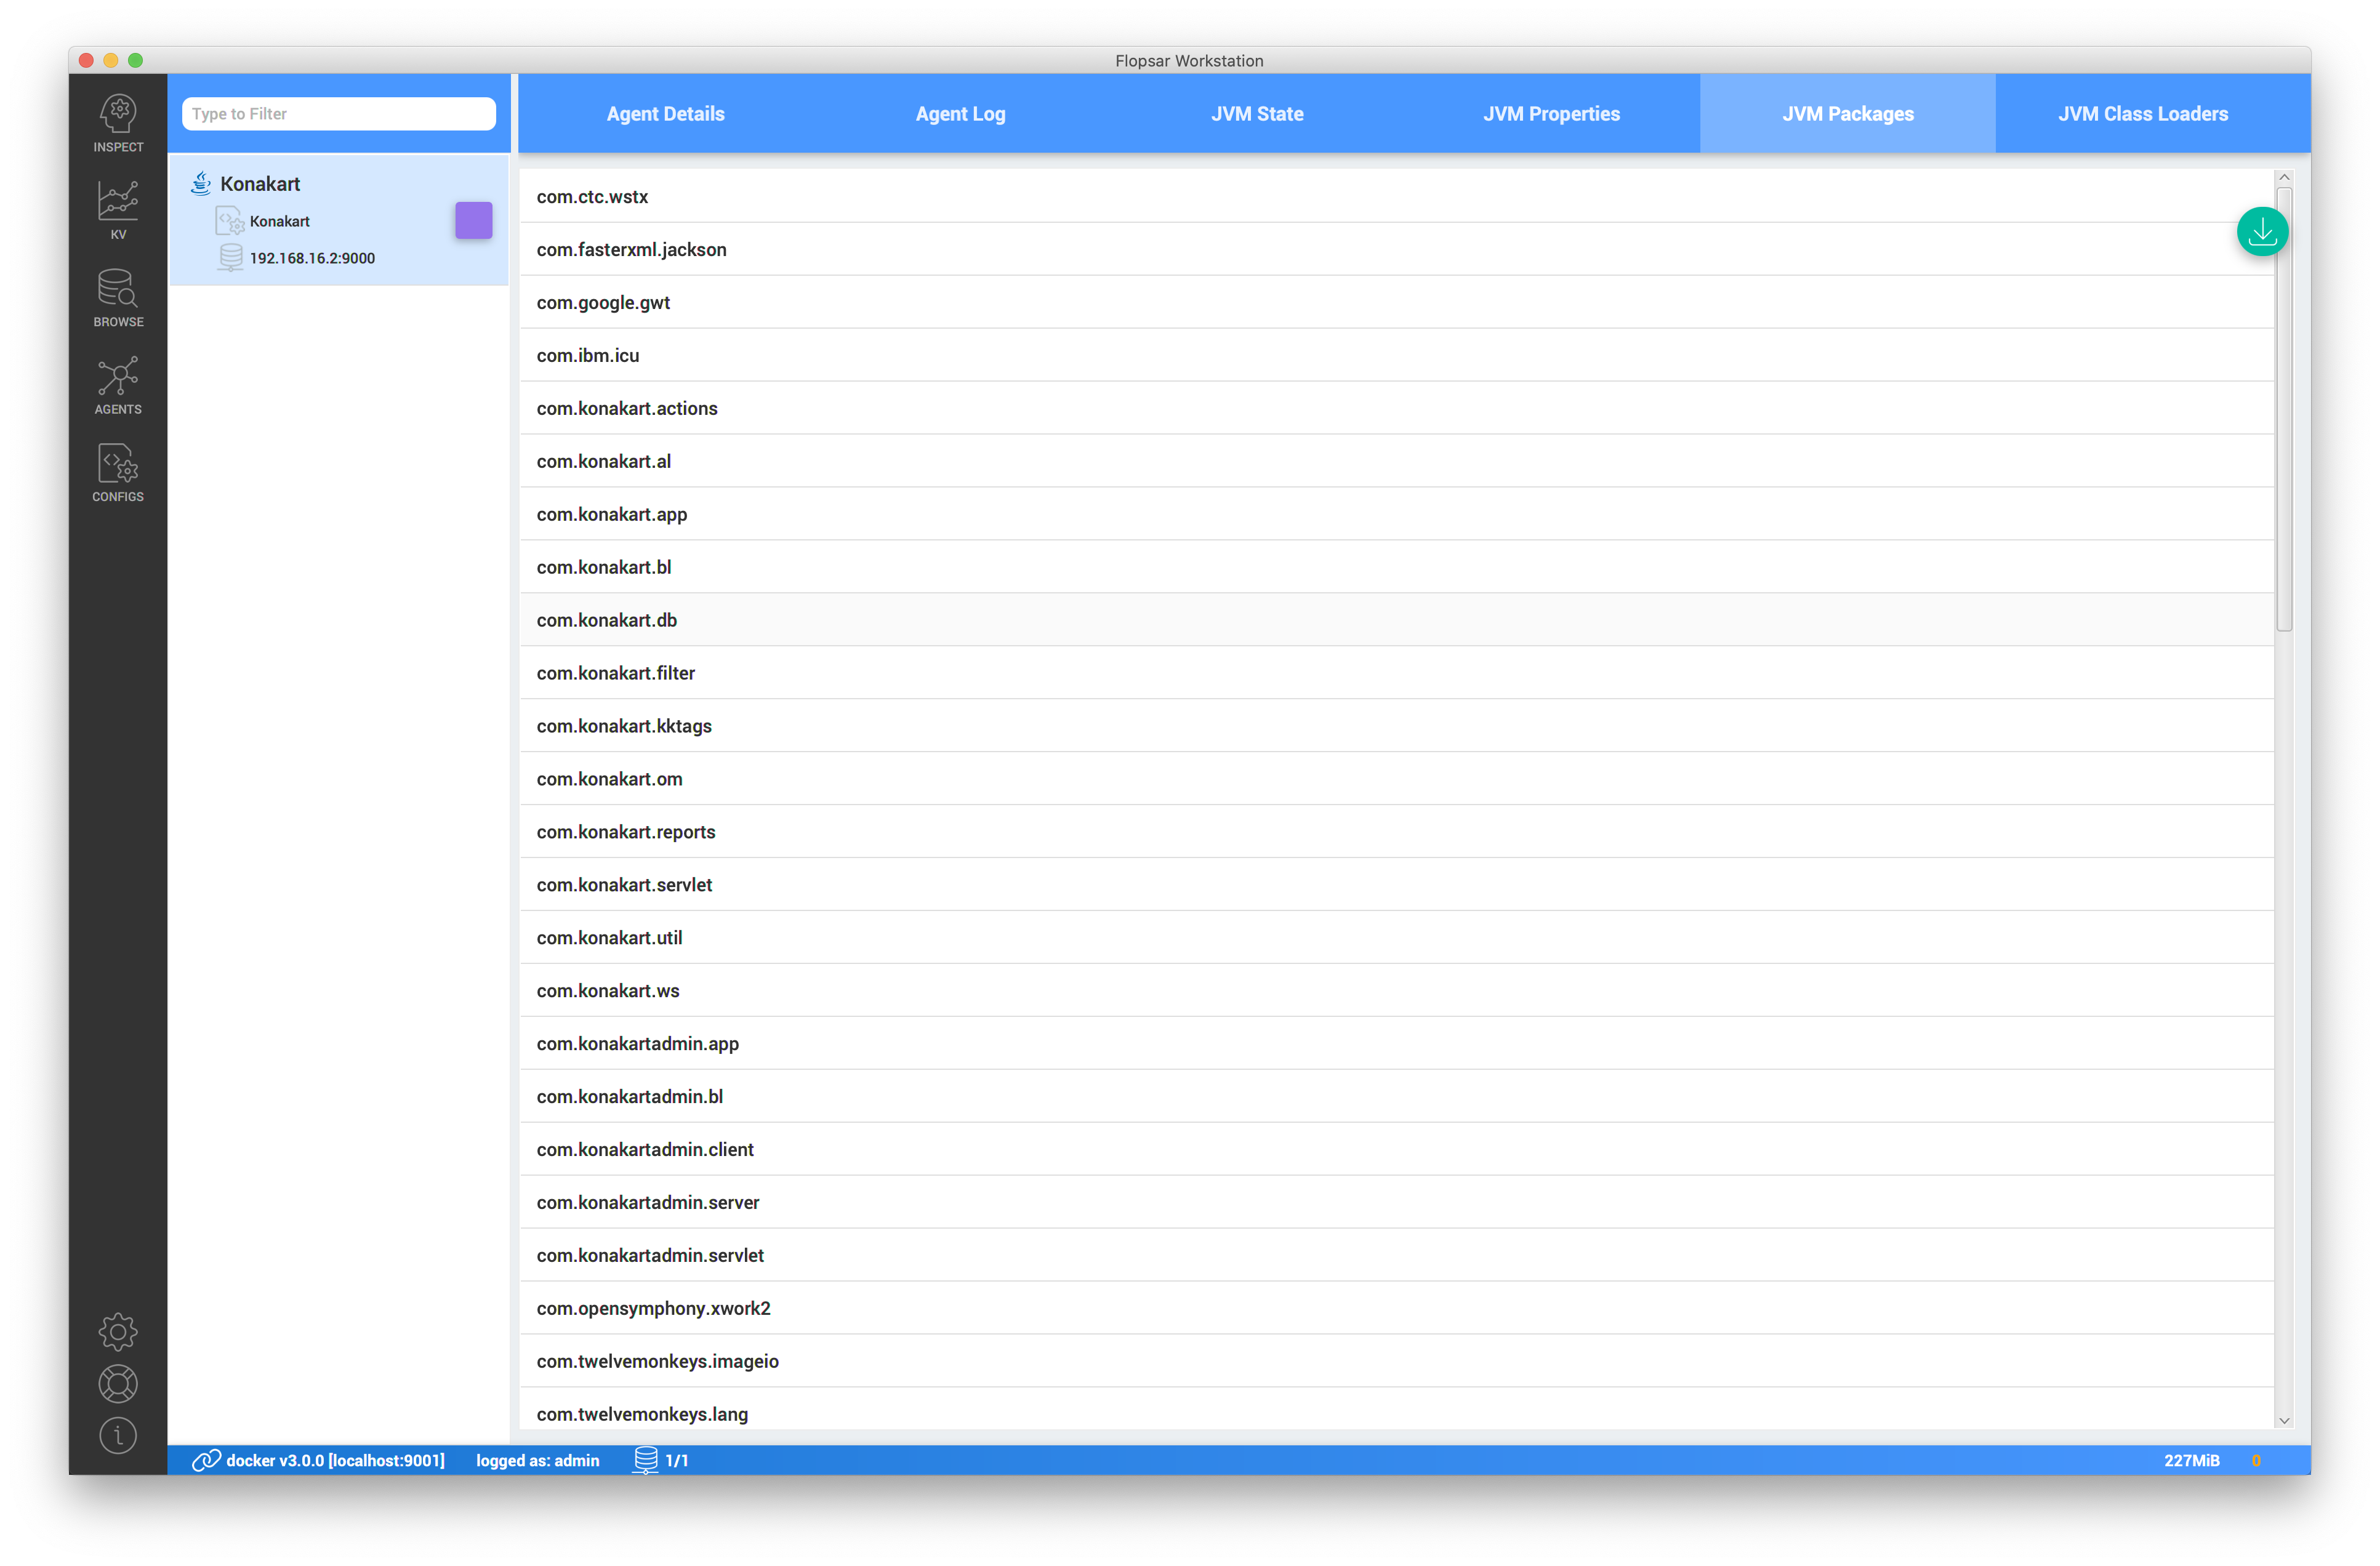
JVM Packages
This feature allows you to see what packages are available in your application. It is useful if you want to know what packages are available in your Java environment so that you can add some class rules to your configuration. The packages are reported up to the third level.
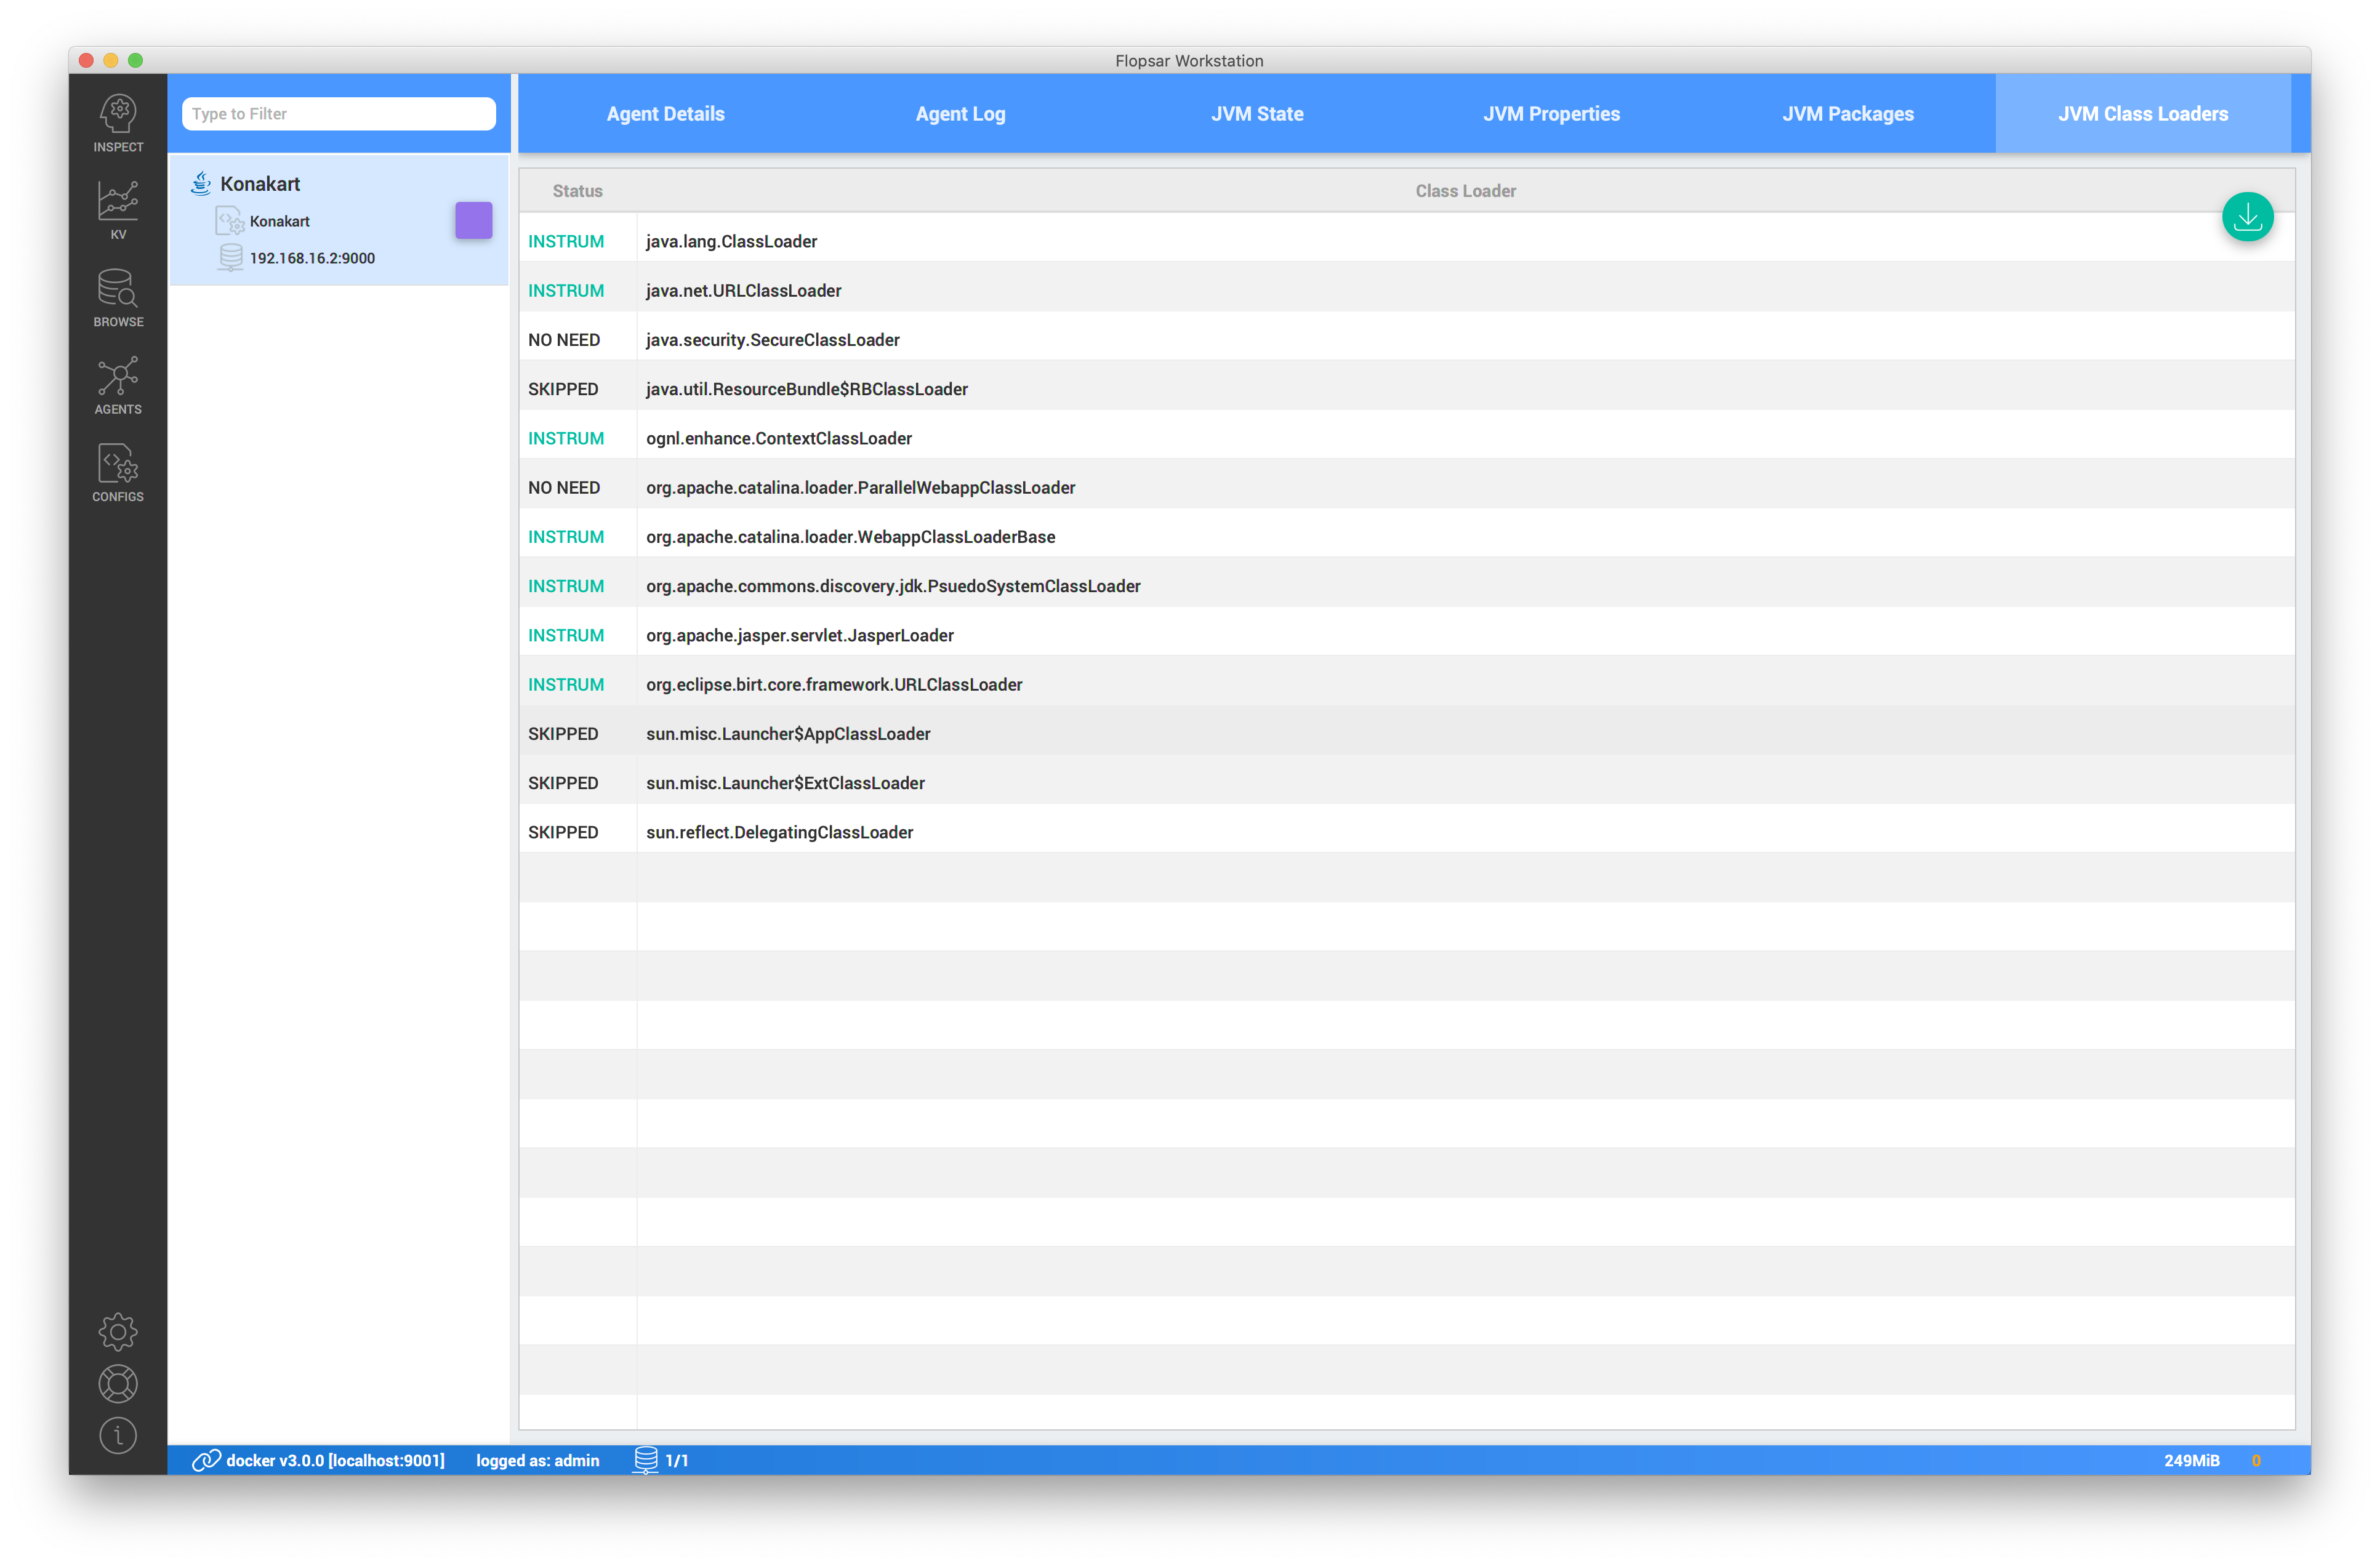
JVM Class Loaders
You can retrieve a list of class loaders detected by Agent. The result is presented in the form of a table. Each reported class loader can be in one of the four available states:
PENDING: to be instrumented,NO NEED: has been checked and no instrumentation is needed,SKIPPED: has not been checked and will not be instrumented,INSTRUM: has been instrumented.